Are Disney Rides Getting Less Reliable?
The internet is pretty sure Disney rides are falling apart. Every trip report has a story about Space Mountain going down, about Rise of the Resistance evacuations, about the carousel that somehow broke. We tracked every ride status change across all six Disney parks for the last four years, between 2022 and 2025, to find out if it’s true.
The short answer is no, on the two metrics that actually measure reliability. Average ride uptime across the six parks climbed from 97.0% to 97.4%. Our own metric, the Shame Score, a weighted score that counts flagship rides more heavily and is the metric we built for cross-park comparison, dropped 15%. Both numbers go the same direction. A third metric, the raw count of downtime hours across all six parks, barely budged, but that one is mostly an artifact of how Disney has expanded over the last four years.
The biggest takeaway, though, is that overall Disney ride uptime in the US started at 97%, which is already good. The Shame Score improved quite a bit, which we’ll explain later, but the takeaway is Disney rides have excellent reliability by any metric. It’s possible that they were more reliable in decades past, but that’s unlikely given the realities of running complex machinery every day. For the sake of argument, let's imagine that the uptime percentage 20 years ago was an impossible 99%. That would only result in a ride gaining an extra 14 minutes of operation on a typical 12-hour park day.
The most likely explanation for the disconnect is the rise of social media, where hundreds of people take time out of what should be an enjoyable park day to complain about a down ride online.
We don’t have detailed stats on what was happening at Disney in the previous century, but here is what we do know now.
Start With One Ride: Magic Kingdom’s Space Mountain

Photo by Michael Czeiszperger.
John Hench’s Space Mountain has been a Magic Kingdom Tomorrowland headliner since January 1975, the original roller-coaster-in-the-dark, with houselights doing the work of stars, retro-80s sound effects that make us forget there’s no sound in space, and a modest top speed which is just fine considering you can’t tell how much clearance there is between your head and the track above you. The cone-shaped exterior is one of the most photographed buildings on Disney property, and the spaceship visible at the ride exit carries Hench’s initials, H-NCH, as a half-century-old calling card. Half a century into its run, Space Mountain is also a useful test case for measuring ride reliability, because there are three obvious ways to do it and they do not all give the same answer.
| Magic Kingdom Space Mountain | 2022 | 2025 | Change |
|---|---|---|---|
| Breakdown events | 812 | 298 | −63% |
| Avg event duration | 28 min | 78 min | 2.8× |
| Total downtime hours | 184 hrs | 144 hrs | −22% |
| Uptime % | 92.75% | 94.61% | +1.86 pts |
Three metrics, three magnitudes. Event count says Space Mountain got transformed: 63% fewer breakdowns over four years. Total downtime hours says it improved a third as much. Uptime percentage, which is just (operating hours minus downtime hours) divided by operating hours, says the ride was running 92.75% of the time it was supposed to be in 2022 and 94.61% in 2025, an improvement of just under two percentage points. Each is technically true, and they are answering different questions.
Event count answers “how often does it stop?” Total hours answers “how much ride time was lost?” Uptime answers “of the time the ride was supposed to be running, how often was it?” The third question is the one a guest is actually asking. Uptime is the right ride-level metric, and it is what other Disney-tracking sites use.
The other two metrics drift loose for the same reason: each remaining breakdown lasts about three times as long now as it did in 2022. Whatever changed in how Space Mountain is repaired, it consolidated many short stoppages into fewer long ones. The event count overstates the improvement. The total hours partly tracks the consolidation rather than the underlying reliability change. Only uptime stays focused on what the guest is actually living through.
The 94.61% is the number to keep in mind. The ride ran almost 95% of its scheduled hours in 2025. The remaining 5% is real, and on a 12-hour park day works out to about 36 minutes of unavailability, which is real too. We will come back to that dual reading after we have the all-park numbers.
Zoom Out to a Park: Disney California Adventure
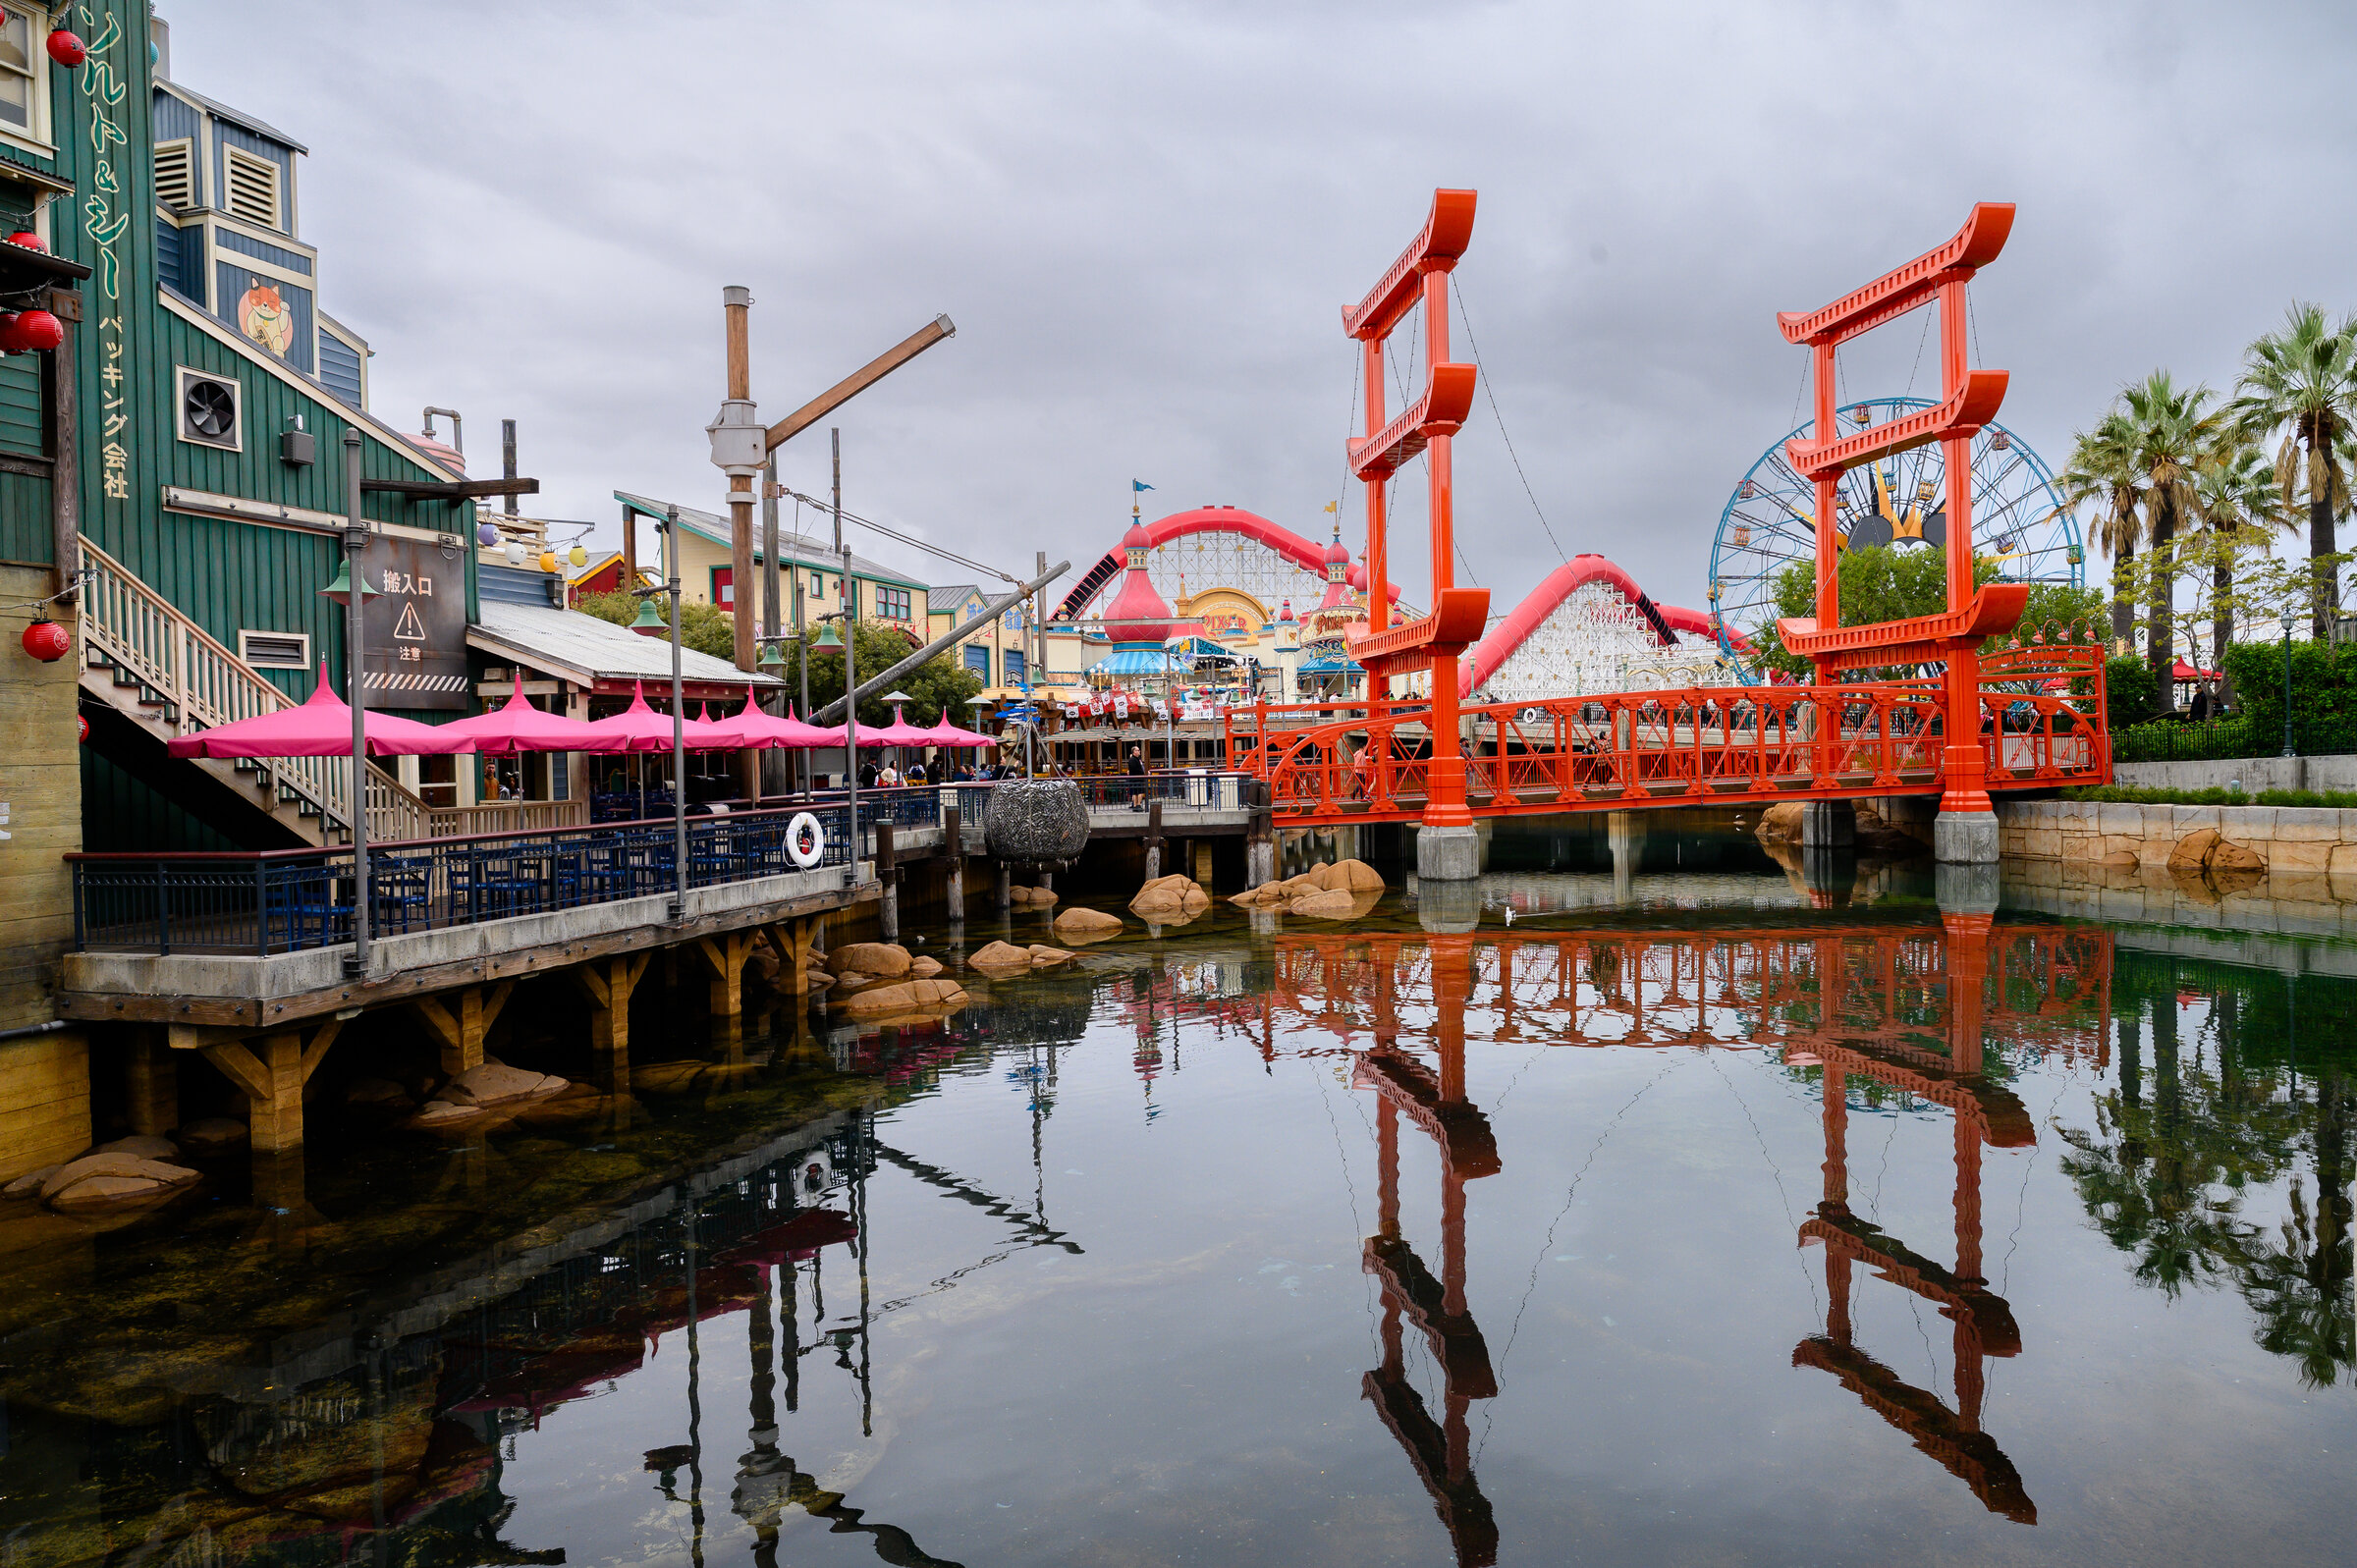
Photo by Michael Czeiszperger.
Add a second ride and uptime gets a problem. DCA tracks 21 active rides as of 2025, ranging from the launched coaster Incredicoaster down to the Mater’s Junkyard Jamboree barnyard spinner. Uptime treats them all equally: a Mater’s outage and an Incredicoaster outage move the metric by the same amount. A guest does not experience them that way. If Mater’s goes down for an hour, you walk past it and notice nothing. If Incredicoaster goes down for an hour, your afternoon plan dies.
This is the gap the Shame Score exists to fill. It is a weighted version of the same downtime calculation, with each ride scaled by its tier so flagships count more.
WEB SLINGERS opened in June 2021 as the centerpiece of Brent Strong’s Avengers Campus, the gesture-tracking Spider-Man shooter that lets guests fling animated webs at runaway robots. It is also the most fragile ride in the dataset. WEB SLINGERS broke down 1,285 times in 2025, which is 3.5 breakdowns per day, every day, for an entire year. By rights, that one ride should have dragged DCA’s reliability down between 2022 and 2025. Instead, DCA’s reliability climbed by every measure that matters: the Shame Score dropped 27%, uptime climbed from 96.4% to 97.2%, and even total downtime hours fell a few percent. All three improved, all three by the largest margin in the resort.
Whatever DCA changed operationally, the rest of the park absorbed WEB SLINGERS’s chaos and still came out ahead. The Shame Score declined every single year, 2022 through 2025. It is the steadiest improvement at any Disney US park, and it is the cleanest argument for why a weighted metric is worth the extra math: an unweighted uptime number could not have shown how much heavier a flagship ride’s outages weigh against the fillers, but DCA’s Shame Score caught it.
The Constant Cough vs. The Long Silence
Now the metrics travel. Walt Disney World averages about 180 breakdowns per ride per year. Disneyland Resort averages 440. That is not a typo. DLR rides break 2.4 times more often than their WDW counterparts. If you only looked at that number, you would assume Anaheim was a disaster.
It is not, because DLR has gotten substantially faster at fixing things. Average breakdown duration dropped from about 50 minutes to 42 between 2022 and 2025, a step change that landed in 2024 and held. Major breakdowns, the ones lasting over an hour, fell from 26% of all events to 20%. The rides still go down constantly. They just come back faster, and the long outages that wreck your afternoon happen less. DLR’s Shame Score dropped 18% (0.370 to 0.302); uptime climbed from 96.75% to 97.29%.
WDW took the opposite path. Breakdown frequency dropped 15% over the same period (212 per ride per year down to 180), while resolution time crept the wrong way, edging from 50 to 51 minutes. Major-event share rose from 27% to 31%. Fewer things break. When they do, they take a hair longer. WDW’s Shame Score dropped 10% (0.256 to 0.230); uptime climbed from 97.60% to 97.76%. Both coasts improved on both metrics. The mechanisms were different.
The same ride at both coasts shows the same divergence. Disneyland’s Space Mountain, Bill Watkins’s tighter 1977 Anaheim version, saw breakdown events drop 49% over the period while average duration climbed from 23 to 50 minutes. Uptime moved 0.26 points to 94.97%, half the gain Magic Kingdom’s version saw, but in the same direction. Two parks, one ride, identical operational shift toward fewer-but-longer outages.
What the Guest Feels
At DLR, the average tracked ride goes down a little over once per day, and the average outage lasts about 42 minutes. At WDW, the average tracked ride goes down about once every two days, and outages last about 51 minutes. DLR’s problem is frequency. WDW’s problem is fewer but slightly longer interruptions.
All Six Parks Together
Aggregated across all six Disney US parks, the Shame Score dropped from 0.331 in 2022 to 0.281 in 2025, an improvement of 15%. Average ride uptime climbed from 97.03% to 97.42%, a gain of 0.39 percentage points. The two metrics agree at every park, with one wrinkle: the Shame Score moves more sharply than uptime when the gains are concentrated in flagship rides, because that is what it is built to do.
The standouts are DCA (-27% Shame, +0.80 pts uptime) and Animal Kingdom (-23% Shame, +0.50 pts uptime). The middle of the pack: Disneyland (-14%, +0.39), Epcot (-13%, +0.19), Magic Kingdom (-9%, +0.13). The laggard: Hollywood Studios, where the Shame Score bounced 0.228 to 0.261 to 0.177 to 0.211 across the four years and uptime moved barely a tenth of a point. Joe Rohde’s Animal Kingdom finished the period as the most reliable Disney park in the dataset at 98.25% uptime, helped by an unusually clean 2025.
The third metric, total downtime hours, is the one to be careful with. Across all six parks combined it went from 13,368 hours in 2022 to 13,661 in 2025, basically flat. At DLR specifically it went up 5%, even though the Shame Score and uptime both improved. The reason is straightforward: Disney added rides between 2022 and 2025 (DLR went 51 to 54 active rides, WDW 49 to 53) and operating calendars expanded. More rides and more operating hours create more total opportunities for downtime, even when each individual ride is breaking down less. The rate metrics correct for that. Counting hours does not. This is why total hours, despite being the most intuitive metric, is the least useful one at the park level.
The Rides That Tell the Story
The aggregate verdict comes from 50-plus rides per coast, but a few of them carry most of the story. We have already met WEB SLINGERS, the 1,285-events-a-year poster child for DLR’s high-frequency operational philosophy, and Magic Kingdom’s Space Mountain, the cleanest example of fewer-but-longer breakdowns. Each event at WEB SLINGERS averaged 24 minutes, short by Disney downtime standards, but it still added up to 507 hours of unavailability over the year. Guests rarely see a sustained closure; the ride is closed a lot in aggregate.
Incredicoaster, the 2018 retheme of California Screamin’ that Werner Stengel engineered for Tim Delaney’s Paradise Pier, has stayed DCA’s best straight-up thrill ride for two decades. The Pixar retheme added Jack-Jack chaos in the launch tunnels, so a generic seaside coaster suddenly runs through what feels like a Pixar short. It also averages 97 minutes per breakdown, the longest in the dataset. You could watch a feature film in the time it takes Incredicoaster to come back. When it goes down, clear your afternoon.
Indiana Jones Adventure, Tony Baxter’s 1995 Adventureland headliner and the high-water mark of the Enhanced Motion Vehicle era, has gotten 31% more reliable on event count alone. Bouncing jeeps, a rolling boulder finale, and a randomized warning from Mara that gives every ride a slightly different read. Test Track replaced EPCOT’s World of Motion in 1999 and was reimagined again in 2025, this time with a deliberate look back at its predecessor’s mid-century optimism, including direct nods to Walt’s Progress City model. Its 2025 numbers belong in their own category: a freshly retuned ride coming off a year-long closure.
| Ride | Park | 2025 Breakdowns | Avg Duration | vs 2022 |
|---|---|---|---|---|
| WEB SLINGERS | DCA | 1,285 | 24 min | +28% more, 5 min faster |
| Space Mountain | Magic Kingdom | 298 | 78 min | 63% fewer, 50 min slower |
| Space Mountain | Disneyland | 458 | 50 min | 49% fewer, 27 min slower |
| Incredicoaster | DCA | 413 | 97 min | Longest avg duration |
| Indiana Jones™ Adventure | Disneyland | 914 | 32 min | 31% fewer |
| Test Track | Epcot | 323 | 55 min | Reimagined 2024–2025 |
97% Is Engineering-Grade. The 3% Still Catches You.
The opening said Disney’s 97% uptime is “already good.” Here is the engineering grounding for that. 97.4% sounds like a B-minus on a school test, which is the wrong scale. In software, a 97% uptime SLA means a server is allowed to be down for 11 days a year. Most enterprises pay extra for “three nines,” 99.9%, which still allows almost nine hours of outage. A complex roller coaster, subjected to constant mechanical stress, running thousands of cycles a day, in temperatures that range from 50 to 105 degrees Fahrenheit, hitting 97% to 98% availability is engineering on a good day.
But 3% of a 12-hour park day is 22 minutes. Across 50 rides, that adds up to closures the average guest will notice. The 3% is real even when the 97% is impressive. Both numbers describe the same park; they describe different parts of the experience. The engineering reality and the guest reality will never be the same number.
The other way to read the same percentage is the one that decides whether a trip feels broken: the chance of personally encountering a closure at all. At 97.4% park uptime, a guest who rides ten attractions in a day has roughly a one-in-four chance (about 23%) of hitting at least one closed ride. The math is straightforward: probability of zero closures is 0.974 raised to the tenth power, or about 77%, so the probability of at least one is the rest. Move the park up to 98% uptime and the odds drop to 18%. Move it to 99% and they fall to under 10%. Past 99.5% you have to work to find a closure on a normal park day. That last territory is where best-in-class individual rides actually live (Avatar Flight of Passage runs at 99.66%), but no whole park runs its entire ride floor that hot.
Would the average guest notice a 0.4-percentage-point park uptime improvement? No, not on a single trip. They feel the binary: either their ride was open or it was not. A guest who got hit on a 97.4% trip tells the same evacuation story as a guest who got hit on a 97.0% trip. The improvement only shows up across thousands of trip reports, in the slow softening of the internet’s mood. The data does the work; the perception lags.
This is the dual reading the data keeps insisting on. Disney’s parks are simultaneously running better than they were four years ago and not running well enough to keep an unlucky guest from waiting an hour for Space Mountain to come back. The internet’s panic and the engineer’s shrug are both responding to real data. They are reading different rows of it.
At Disneyland Resort, expect frequent short closures and check back in twenty minutes. At Walt Disney World, breakdowns are rarer but take an hour to fix. If your headliner goes down, pivot to something else. Either way, the rides will run when you get there. Spend the time you save on the things rides are not, the topiaries at EPCOT in spring, the orchestra in front of the castle, the cast member who knows where to point your kid for the secret hat trick. The data says reliability is up. The point of being there was never just the rides anyway.
This is the first in a three-part series on ride reliability trends across US theme parks. Next: how Universal’s parks compare, and whether Epic Universe is an outlier or a preview.