The Empty Queue
What 86,000 ride breakdowns reveal about the best-kept secret in theme park wait times.
It’s 2 PM at Magic Kingdom. Space Mountain is posting 85 minutes. Your feet hurt. You’ve been doing the math on whether the wait is worth the three minutes of ride, and the math isn’t great. Then the app changes. “Temporarily Closed.”
Most guests read that and move on. But here’s what they don’t see: when a ride has been down for 30 minutes or more, the physical queue drains. People leave. They go get a Dole Whip, they hop on the Peoplemover, they give up. By the time the ride quietly comes back online, the queue that was 85 minutes deep is functionally empty. The posted wait time in the app hasn’t caught up. For a brief window, you can walk right on.
We’ve been collecting ride status data every five minutes across 33 theme parks since 2021. In 2025 alone, we recorded 86,024 individual ride breakdowns across 11 Disney and Universal parks. That’s enough data to measure exactly what happens to wait times after a breakdown, how long the window lasts, and which breakdowns are worth chasing. The answer to that last question depends entirely on one variable: how crowded the park is when the ride comes back.
This Happens All Day, Every Day
Ride breakdowns are not rare events. Disneyland alone averages 40.8 per day. That’s not a typo. Forty breakdowns, every day, at one park. Magic Kingdom averages 14.6. Islands of Adventure runs 16.3. On a typical week-long Disney vacation spanning three or four parks, you’ll be standing in the park during hundreds of breakdowns. Most of them you’ll never notice.
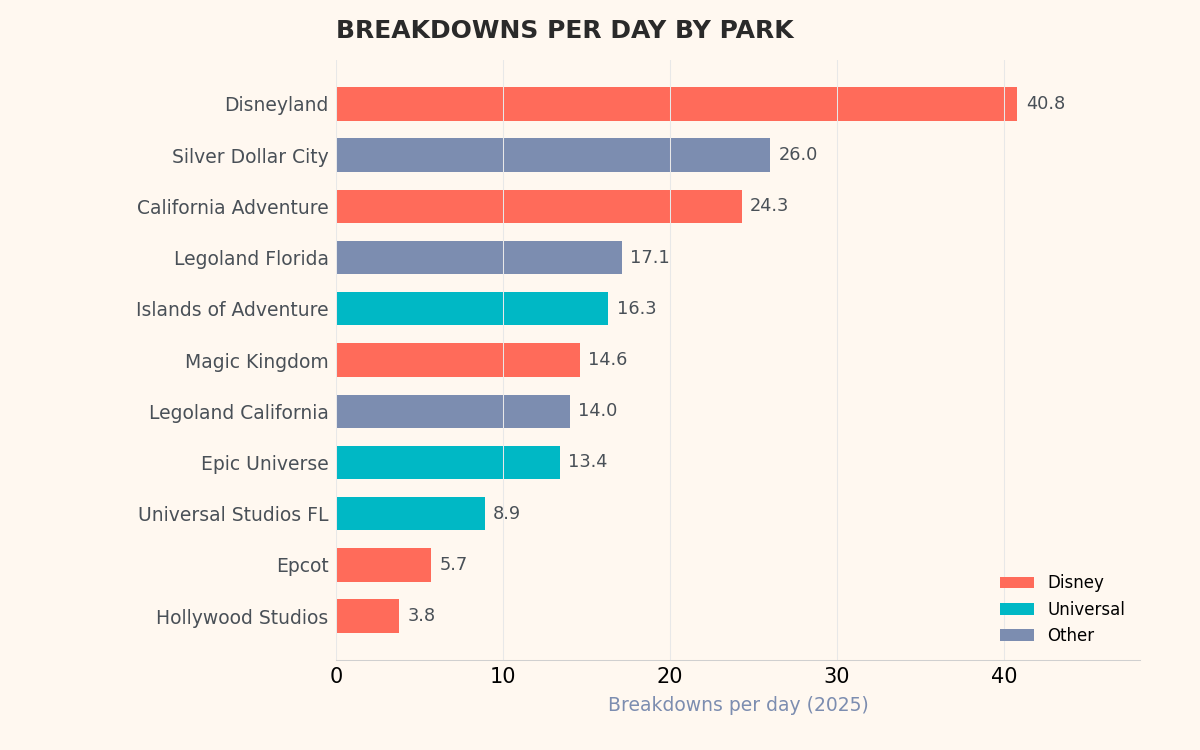
Average daily breakdowns in 2025 by park. Disneyland’s count is partly driven by having the most rides of any single park. The rate per ride is more comparable across parks.
But doesn’t “breakdown” include every little hiccup? It does. A sensor trips, a lap bar doesn’t lock, the ride cycles empty for two minutes and restarts. About 25% of these last under 15 minutes. Those aren’t walk-on opportunities. The queue barely notices.
But 59.5% last 30 minutes or longer. Those are the ones where people leave. Where the queue empties. Where the math changes.
| Duration | Count | % of Total | Walk-on Potential |
|---|---|---|---|
| Under 15 min | 21,309 | 24.8% | None. Nobody left. |
| 15–30 min | 13,567 | 15.8% | Marginal. Some left. |
| 30–60 min | 16,591 | 19.3% | High. Queue is empty. |
| 60+ min | 34,557 | 40.2% | High. Queue is empty. |
That last row is striking. 40% of all breakdowns last over an hour. Those are the big ones, the ones where the ride was having a genuinely bad day. And from a walk-on standpoint, they actually offer better odds than the 30–60 minute range, because more people have given up and scattered. We’ll come back to that.
The Empty Queue Effect
Here is the central claim of this analysis, and it’s one you can verify next time you’re at a park: when a ride has been closed for 30 minutes or more, the physical queue is empty when it reopens.
Not “shorter.” Empty. The switchbacks are folded. The cast members are standing in an empty corridor. The posted wait time in the Disney app is either showing whatever stale number was there when the ride went down, or some arbitrary minimum that has nothing to do with who’s actually in line. Nobody is.
We can’t prove this from our data alone. We track posted wait times, not physical queue counts. But the posted data is consistent with it, and anyone who has stood outside a ride that just reopened from a long closure knows the feeling: you walk through a queue designed for a thousand people, and you are the only one in it.
The Posted Wait Lag
Disney’s posted wait times are not stopwatches. They’re algorithmic projections that factor in expected demand, Lightning Lane returns, ride capacity, and recent queue flow. When a ride reopens after a long closure, the system has no recent queue data to work with. The posted time is either frozen at its pre-breakdown value or set to a default minimum. It takes 10 to 15 minutes after reopening for the first real guests to pass through the queue sensors and for the posted time to reflect reality. That lag is the walk-on window.
This is why the posted wait data understates the actual opportunity. Our recovery curve analysis shows posted waits dropping about 5 minutes below normal after reopening. But 5 minutes below normal isn’t what’s happening in the physical queue. What’s happening is zero. The posted number just hasn’t caught up yet.
The Dip and the Rebound
We built per-ride recovery models for every ride with enough breakdown history. The chart below shows Toy Story Mania at Hollywood Studios, one of the clearest examples in the dataset. Zero on the y-axis is the expected wait for that time of day and day of week. Below zero means shorter than normal. Above means longer.
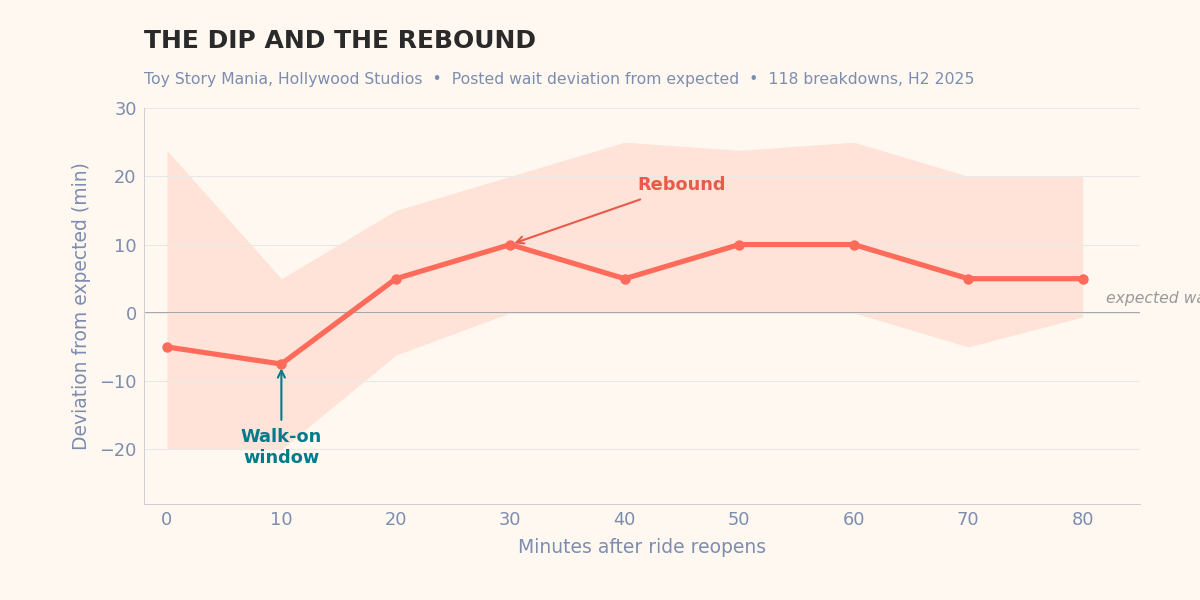
Toy Story Mania’s recovery pattern across 118 breakdowns. The shaded band is the interquartile range. The dip bottoms out at 10 minutes; the rebound overshoots normal by 30 minutes and stays there.
Two things jump out. First, the walk-on window: posted waits dip below expected in the first 10 to 15 minutes after reopening, with the deepest point at around 10 minutes. This is when the queue is genuinely empty and the posted time is playing catch-up. Every ride we analyzed shows the same pattern. The best arrival window is consistently 10 to 20 minutes after reopening.
Second, the rebound. By 20 to 30 minutes, waits don’t just return to normal. They overshoot it. Toy Story Mania runs 10 minutes above expected wait for the next hour. Everyone who heard the ride was back rushes over at once, the ride is still ramping up to full dispatch speed, and Lightning Lane holders whose return times were disrupted are getting priority access. The result is a temporary line that’s worse than if the breakdown had never happened.
If you arrive at minute 25, you’re not catching a walk-on. You’re catching the rebound. The window opens fast and closes faster.
Bigger Crowds, Bigger Payoff
The question everyone asks about post-breakdown walk-ons is “how much time does it actually save?” The honest answer: it depends entirely on how crowded the park is. On a quiet Tuesday in September, rides are already posting 15-minute waits. A breakdown that drops the wait to 10 minutes saved you five minutes. Congratulations. You could have saved the same amount by walking slightly faster.
On a packed Saturday in July, that same ride is posting 70 minutes. A breakdown that drops it to 10 saves you an hour. Same ride. Same breakdown. Completely different value.
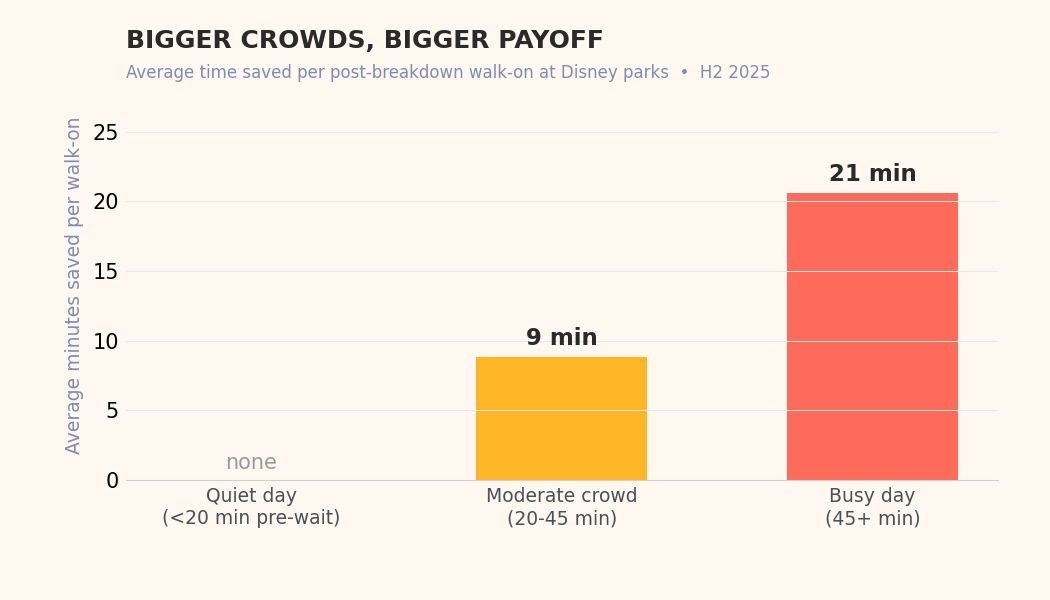
Time savings per walk-on at Disney parks, segmented by how busy the ride was before it broke down. On busy days, a single walk-on saves 21 minutes.
We measured the average wait before the breakdown against the posted wait at reopening across 6,101 events at Disney parks in the second half of 2025, segmented by crowd level:
| Pre-Breakdown Wait | Events | Avg Before | Avg After | Saved | Walk-on ≤10 min |
|---|---|---|---|---|---|
| Low (<20 min) | 2,217 | 8 min | 8 min | 0 min | 80.2% |
| Moderate (20–45 min) | 2,576 | 33 min | 24 min | 9 min | 19.0% |
| High (45+ min) | 1,308 | 67 min | 47 min | 21 min | 4.7% |
There’s an irony buried in that table. The walk-on rate (posted wait under 10 minutes) is highest on quiet days (80%) and lowest on busy days (4.7%). But who cares about a walk-on when the ride was already posting 8 minutes? On the days where a walk-on would actually matter, the odds are worst. The universe has a sense of humor about this.
But the posted wait is probably inflated, right? Almost certainly. Remember the Posted Wait Lag. Those “47-minute” average post-recovery waits on busy days are posted numbers, not real queue times. The physical queue is likely much shorter than 47 minutes. Disney is posting a cautious projection while the ride ramps back up. The real savings on a busy day are probably larger than 21 minutes. We just can’t measure exactly how much larger from posted data alone.
Not Every Park Is Equal
Walk-on rates after 30+ minute breakdowns vary dramatically by park, and the reason is straightforward: parks with higher-demand rides have stickier queues.
| Park | Events | Avg Before | Avg After | ≤10 min | ≤20 min |
|---|---|---|---|---|---|
| California Adventure | 1,438 | 26 min | 21 min | 48.2% | 67.8% |
| Magic Kingdom | 1,125 | 28 min | 20 min | 42.2% | 68.1% |
| Disneyland | 2,719 | 28 min | 21 min | 38.7% | 62.7% |
| Epcot | 421 | 51 min | 36 min | 19.2% | 37.3% |
| Hollywood Studios | 398 | 60 min | 41 min | 7.0% | 25.6% |
Hollywood Studios is the outlier. Only 7% of post-breakdown waits drop to 10 minutes or less. The park has a small number of extremely high-demand rides (Slinky Dog Dash, Rock ’n’ Roller Coaster, Rise of the Resistance) where people don’t leave the queue. They wait it out. If you were willing to stand in an 80-minute line in the first place, you’re not walking away from a breakdown. You’ve already committed too much time.
DCA and Magic Kingdom, by contrast, have a mix of headliners and mid-tier rides with lower pre-breakdown waits. When a ride that was posting 30 minutes goes down, people have less sunk cost and leave more readily. The queue empties. The walk-on materializes.
The Thirteen-Minute Floor
If you’ve ever looked at Haunted Mansion’s wait time and wondered why it says 13 minutes instead of 10 or 15, you’re looking at Disney’s minimum posted wait. It is not a coincidence. The number 13 appears as the post-breakdown wait for Haunted Mansion more than any other value in our dataset: 83 times in 2025. More than 20 minutes (28 times), more than 30 minutes (23 times), more than any round number that would suggest an actual queue measurement.
Thirteen is the floor. When Disney’s system doesn’t have enough data to compute a real wait (because, say, the ride just reopened and nobody has walked through the queue sensors yet), it posts 13. The queue is empty. The app says 13 minutes. Those two things are both true at the same time.
This is the Posted Wait Lag in action: the gap between what the app shows and what the queue looks like. Every posted wait under 20 minutes in the first 10 minutes after reopening should be read as “the queue is probably empty and we’re just guessing.”
What This Means for Your Trip
The window is real, but short
After a 30+ minute breakdown, the queue is empty for about 10 to 20 minutes. After that, the rebound kicks in and waits overshoot normal. If you’re more than a 10-minute walk away when the ride comes back, the window is probably closed by the time you arrive.
Busy days are when it matters
On a quiet day, walk-ons after breakdowns save you nothing. On a busy day, a single well-timed walk-on saves 20+ minutes of standing in line. The value scales with the crowd.
Not every park, not every ride
Hollywood Studios headliners rarely produce walk-ons because people don’t leave those queues. Magic Kingdom, Disneyland, and DCA are the best parks for this, with 40–48% of post-breakdown waits dropping to 10 minutes or less.
You can’t plan for this
Breakdowns are random. You cannot predict which ride will go down on your specific day, at what time, for how long. The opportunity is real and the data supports it, but it’s a reactive play, not a scheduled one. You need to be paying attention when it happens.
Eighty-six thousand breakdowns in one year. It sounds like an indictment, and in some ways it is: these parks charge $150 a ticket and the rides stop working forty times a day. But the other truth is that most of those are five-minute resets, the cost of running extraordinarily complex machines in Florida heat for eighteen hours straight, and the fact that a 56-year-old Haunted Mansion runs at 97% uptime is, frankly, remarkable engineering.
What the data reveals is not a flaw you can exploit but a pattern you can recognize. The queue empties. The app lies for a few minutes. And if you happen to be nearby, paying attention, you walk right on. You don’t need a hack or a strategy. You need proximity and timing. The rest of the time, put the phone in your pocket and go see the Dapper Dans.