The Longest Line in America Just Got Shorter: Battle at the Ministry’s 2026 Turnaround
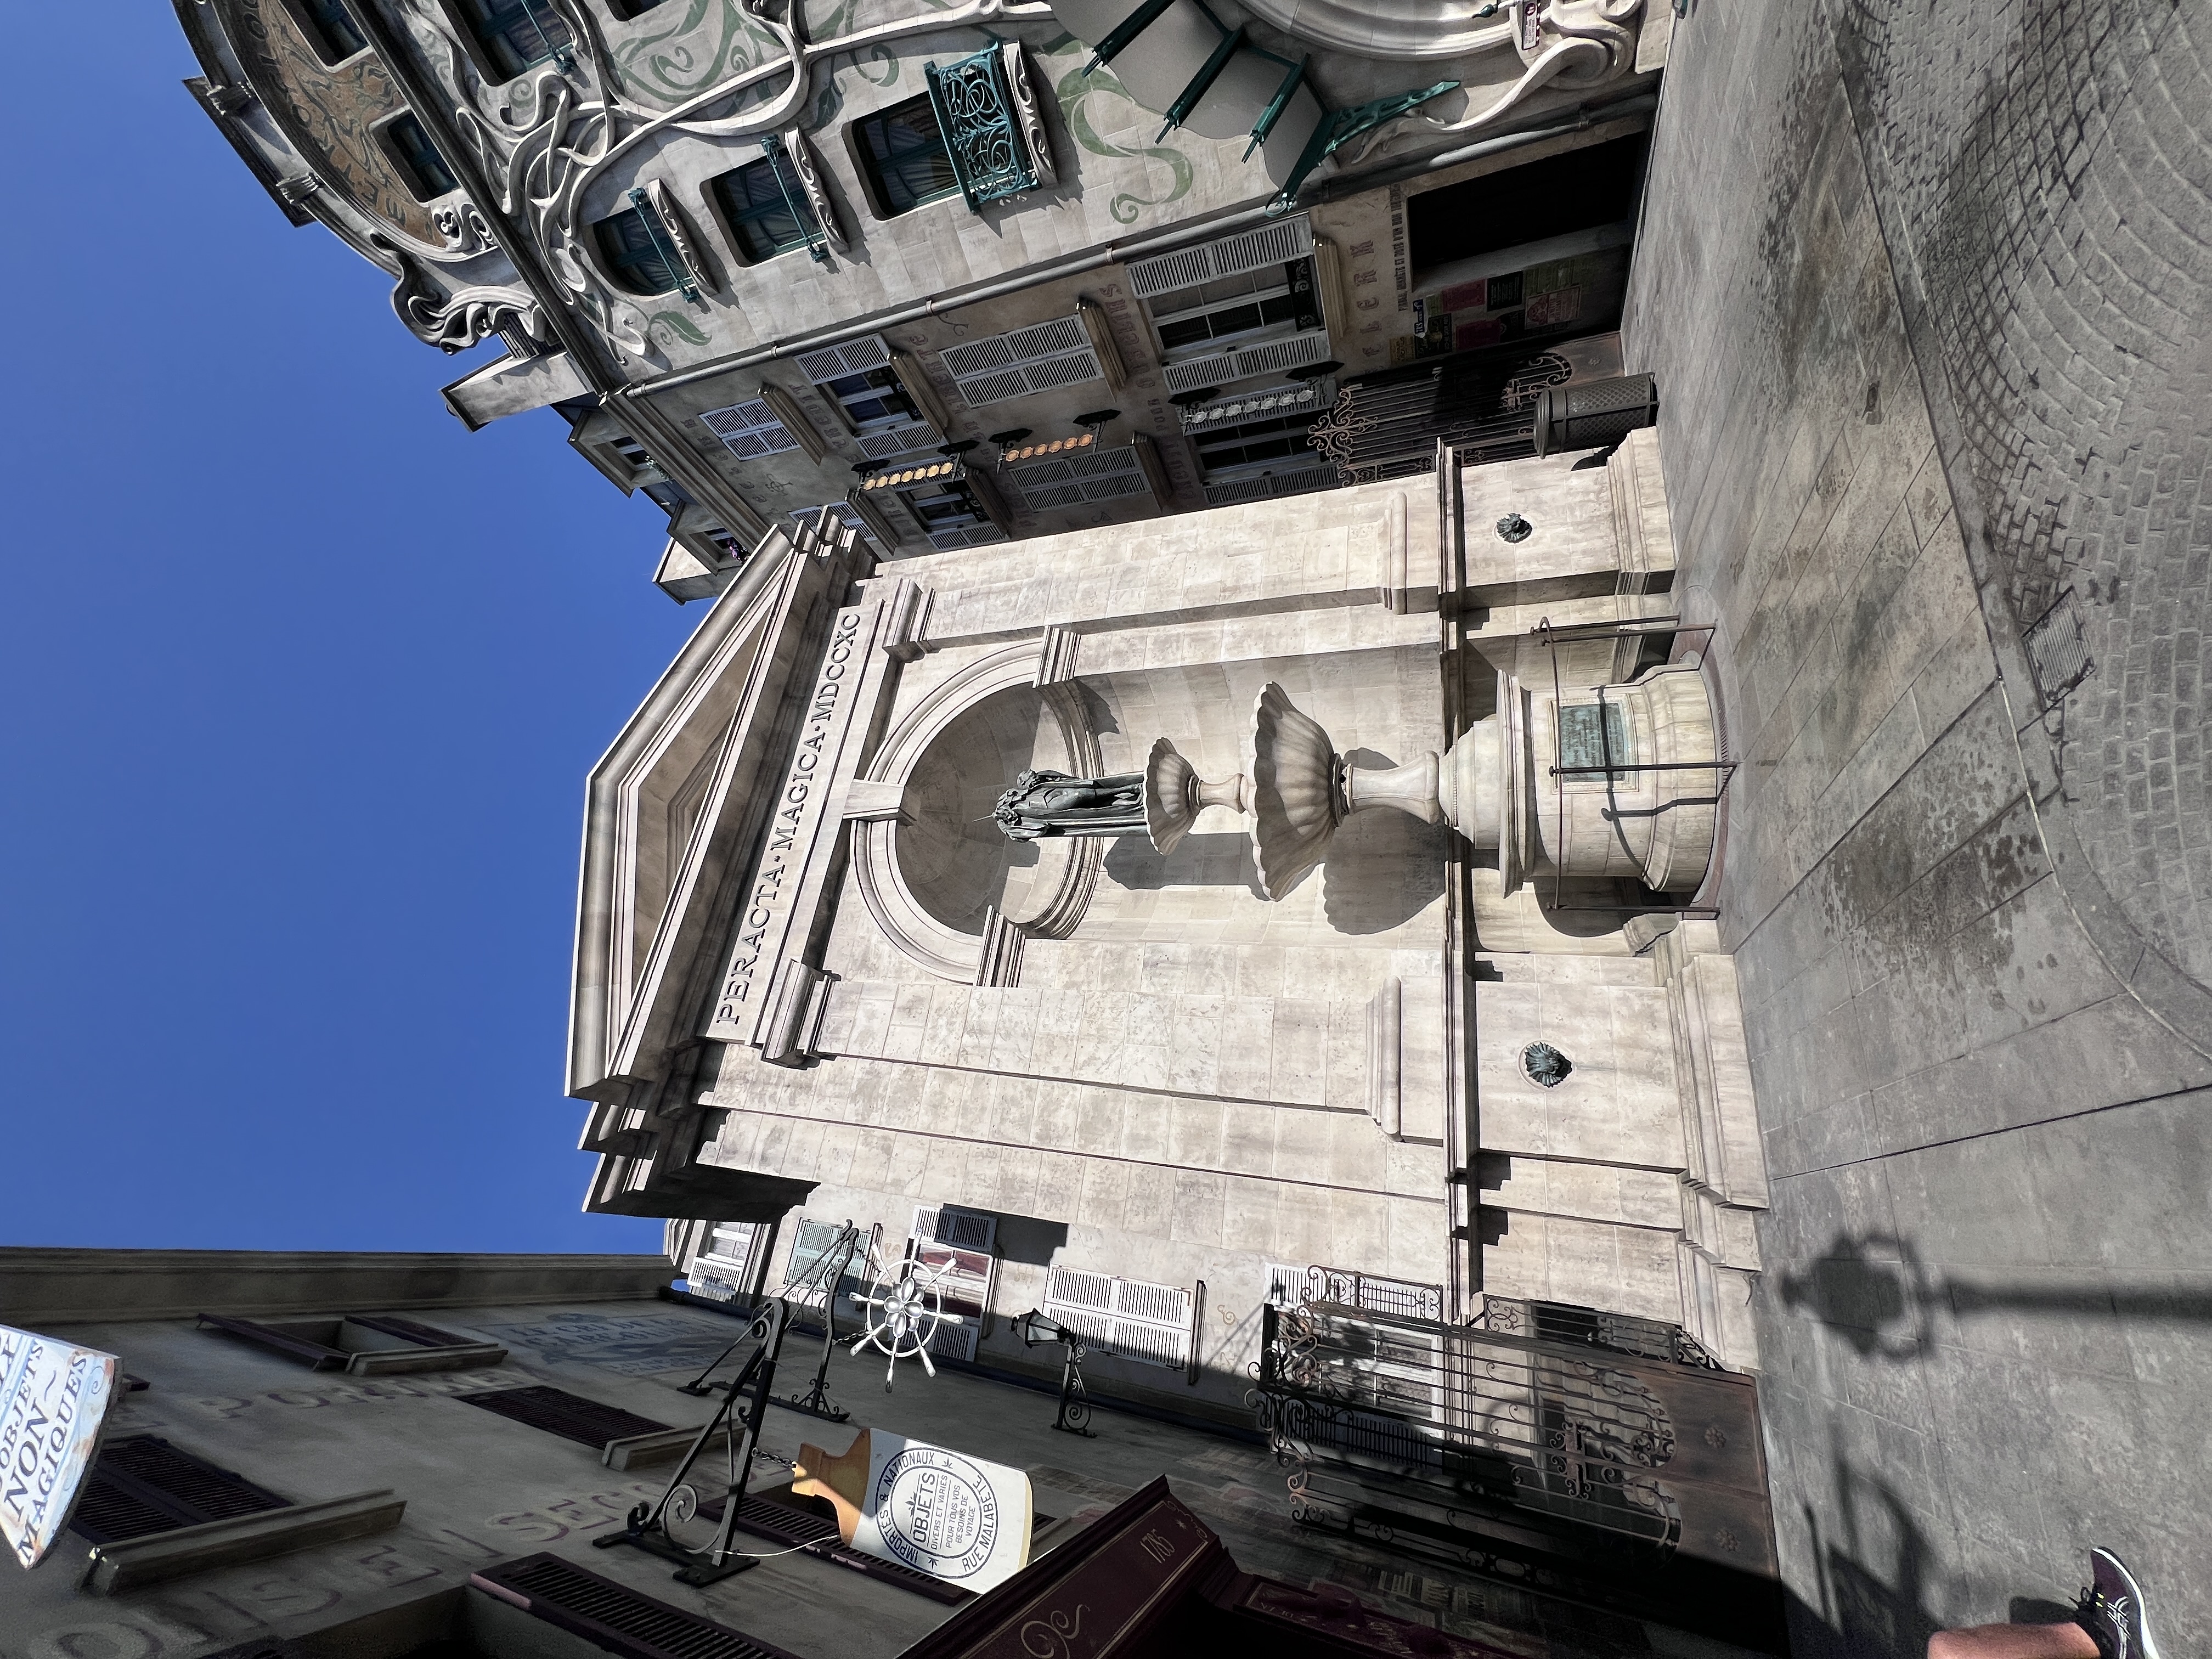
Photo: Michael Czeiszperger
You know the math before you admit it. You’ve been in the switchback for ninety minutes, you can still see where you entered the building, and the posted wait says 120. It’s lying.
Harry Potter and the Battle at the Ministry at Universal’s Epic Universe posted a 115.3-minute daily average wait (the mean of all posted wait times across each operating day) from its May 22 opening through December 31. That was the highest of any ride in the United States in 2025, and it wasn’t close. The next-nearest ride trailed by 11 full minutes. The single highest wait we recorded in any 5-minute data collection hit 380 minutes on December 1. Six hours and twenty minutes. You could watch the first two Harry Potter films back to back and still have over an hour left in line.
What You’re Standing In
Stuart Craig, the production designer whose sets defined all eight Harry Potter films, drew the Ministry of Magic from Victorian institutional architecture and the deep-green tilework of London Underground stations. For Epic Universe, those sketches became a building you walk through. The green marble is real. The queue holds eight hours of guests across a dozen rooms, and every one of them is a film-quality set.
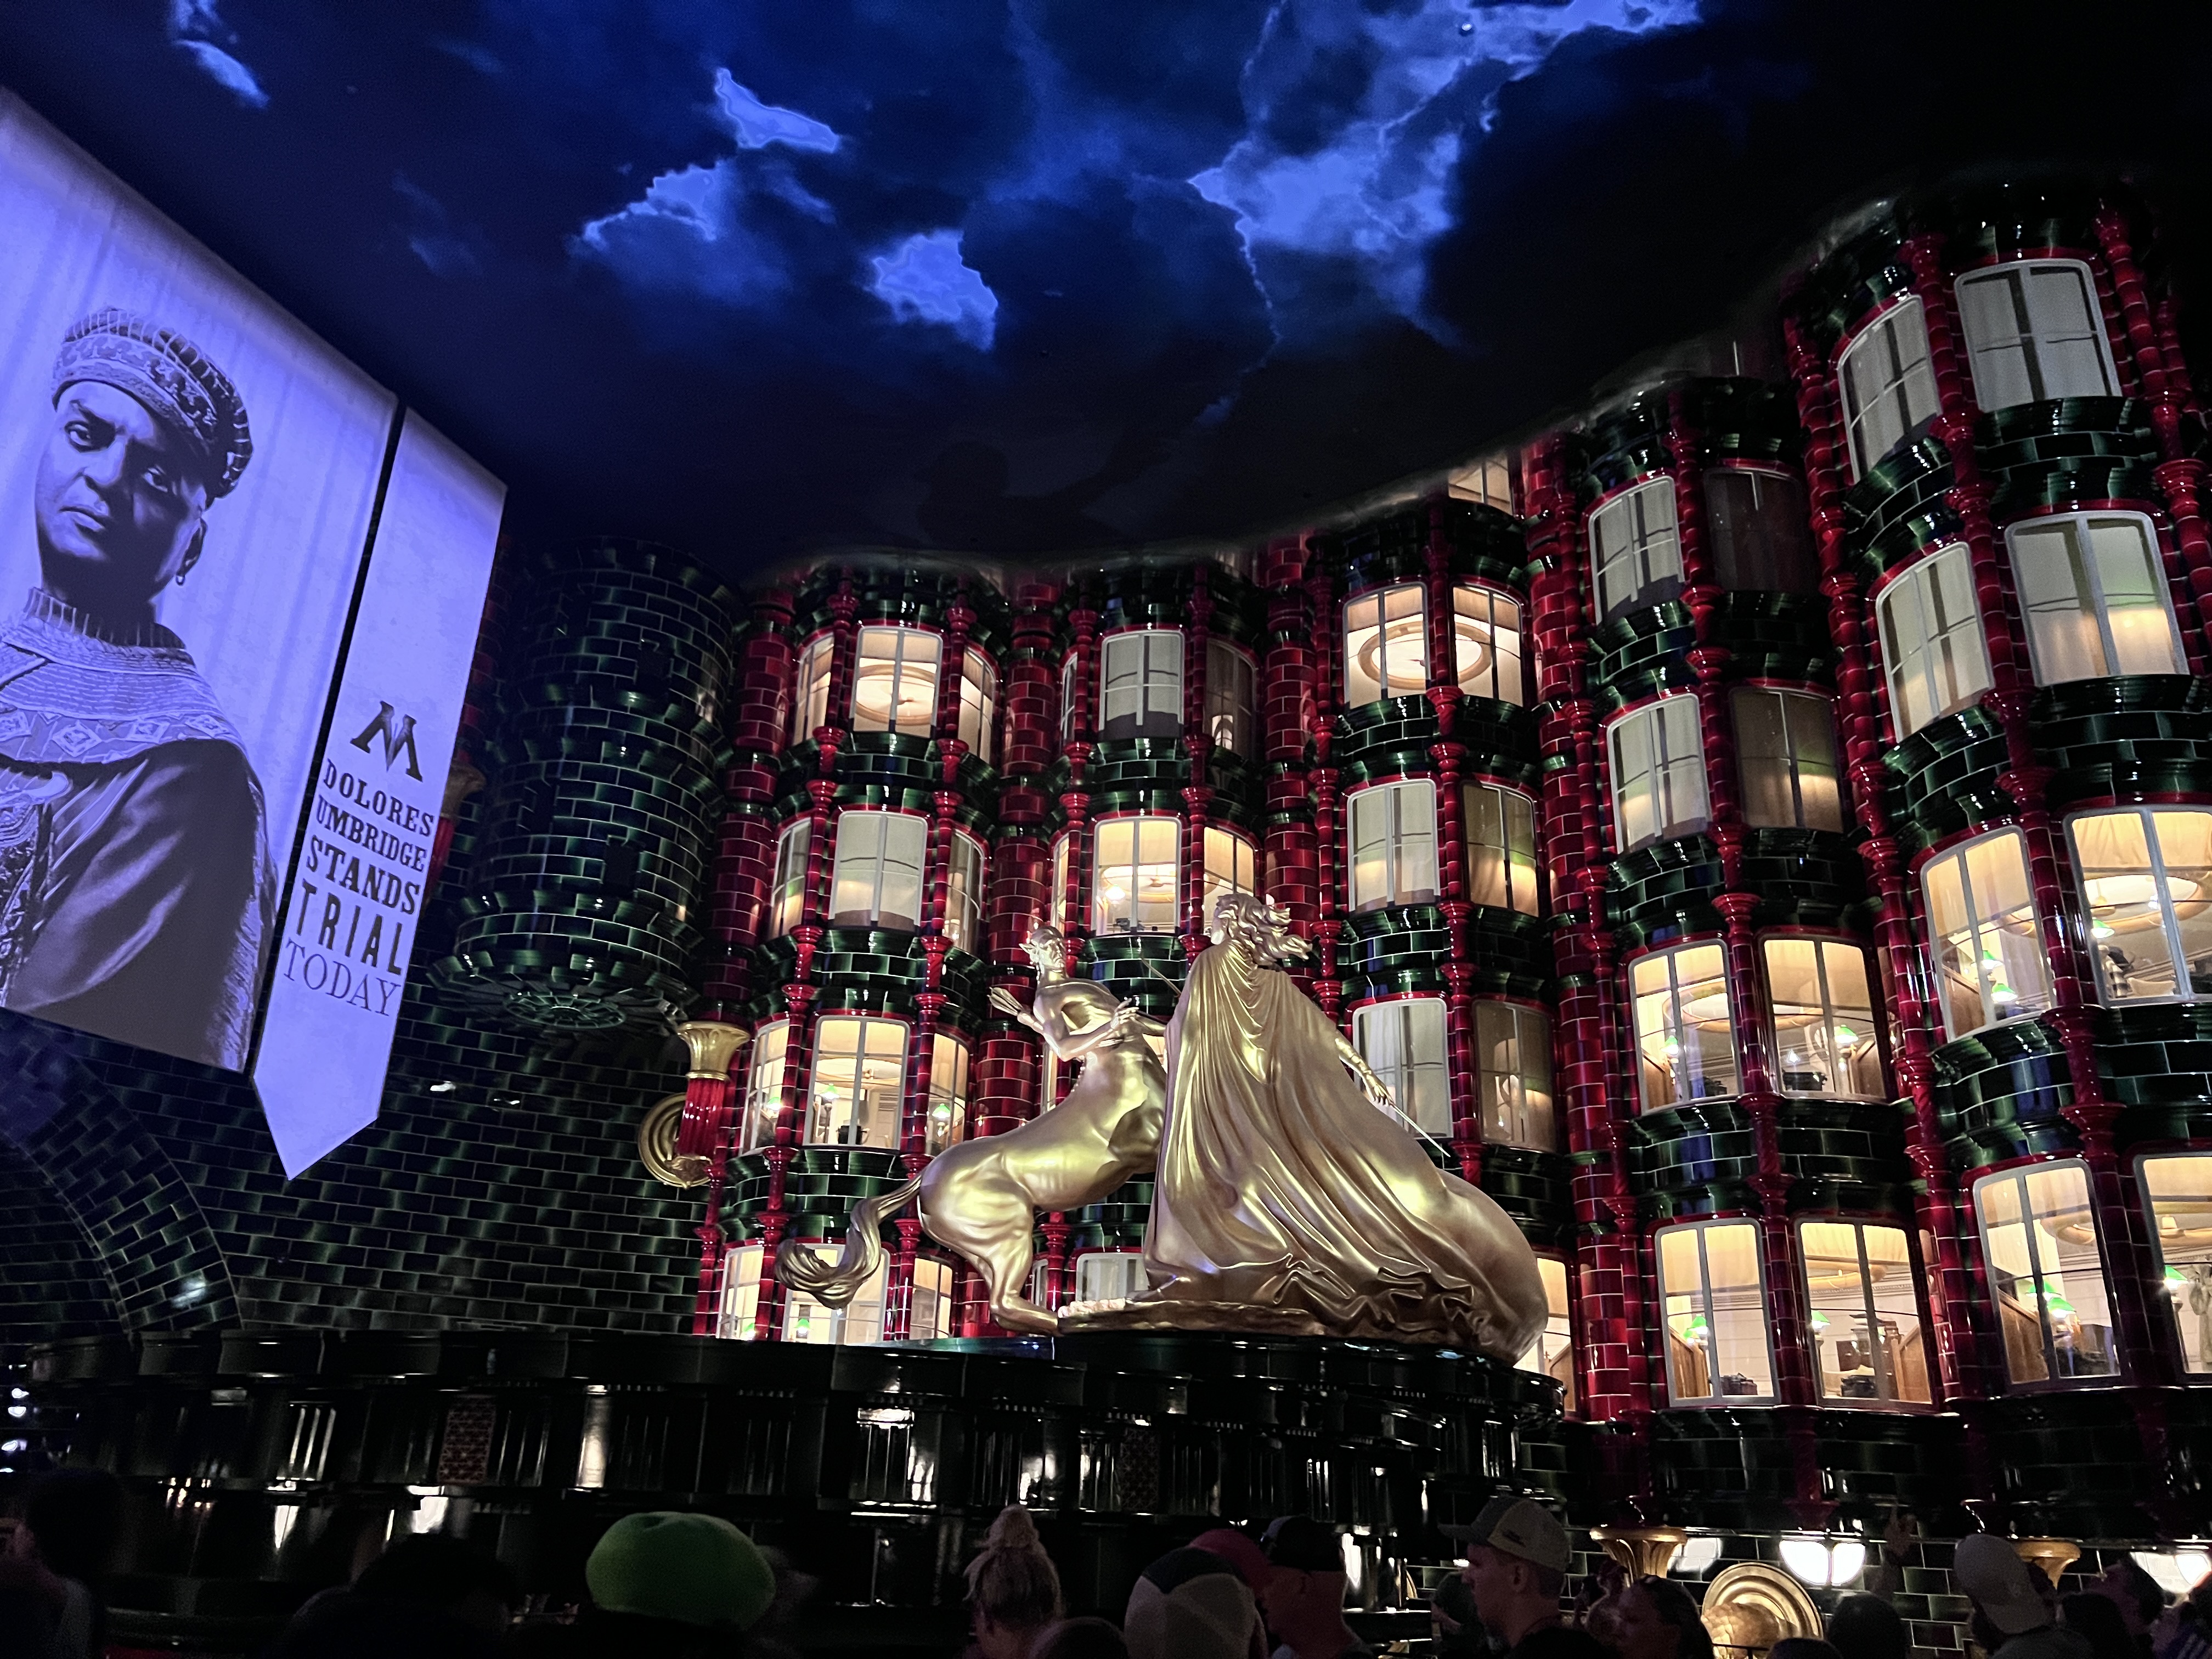
Photo: Michael Czeiszperger
You enter through a 1920s Paris Métro station into the Métro-Floo: a row of green fireplaces that flash with light and smoke as you step through, the Floo Network rendered as a physical threshold. On the other side is the Ministry Atrium, the golden Fountain of Magical Brethren rising beneath flying memos and banners announcing today’s trial of Dolores Umbridge. Past the atrium: reception booths with bank-teller windows, a magical map of the Ministry’s departments, the Ministers’ Hall where talking portraits of past Ministers argue with each other, the Auror headquarters where Harry, Ron, and Neville’s lockers sit next to case files and a portrait of Mad-Eye Moody. Then Umbridge’s office, all pink tile and carved columns and cat plates, where Higgledy, her freed house-elf, delivers a three-minute monologue while packing up her things. You can spend two hours in this queue and not see everything.
But it’s still a queue. The ride is where Universal bet the park. Thierry Coup, Universal Creative’s chief creative officer and the designer behind Spider-Man, the original Wizarding World, and Super Nintendo World, directed Dame Imelda Staunton in London to reprise Dolores Umbridge for the first time in fourteen years. The result: animatronic figures of Harry, Ron, and Hermione (a first for any Universal ride), Death Eater figures with a fluidity that makes every other animatronic in Orlando feel like it’s moving through mud, a physical archives room that rivals the AT-AT hangar in Rise of the Resistance for sheer scale, and a full-size Erumpent that shoves your vehicle sideways. The screens between the practical sets are multi-story LEDs, the sharpest in the industry. The fourteen seats is the cost of all of this. Every vehicle moves independently through rooms built at a scale that doesn’t allow for a conveyor belt or a train. Universal chose spectacle over throughput. The line is the receipt.
The Epic Universe Effect
Battle at the Ministry didn’t just post the longest waits in the country. It brought the rest of the park with it.
| Rank | Ride | Park | Avg Wait |
|---|---|---|---|
| 1 | Battle at the Ministry | Epic Universe | 115.3 min |
| 2 | Mine-Cart Madness | Epic Universe | 104.2 min |
| 3 | Hagrid’s Motorbike Adventure | Islands of Adventure | 103.9 min |
| 4 | Mario Kart: Bowser’s Challenge | Epic Universe | 88.2 min |
| 5 | Radiator Springs Racers | Disney California Adventure | 80.0 min |
This isn’t one ride with a capacity problem. It’s a park. Universal built the most ambitious theme park in a generation and discovered that ambition and throughput are different engineering problems. The rides are extraordinary. The math isn’t.
The Longest Lines in America in 2025
The daily average tells you what a ride is like on a normal day. Peak wait tells you what happens when everything converges: a holiday weekend, a mechanical delay that compressed three hours of demand into one, a park at capacity. These are the highest single posted waits we recorded at any US ride in 2025.
Hagrid’s Motorbike Adventure hit 400 minutes on July 3, when every family in the southeastern United States apparently decided to visit Islands of Adventure simultaneously. Battle at the Ministry’s 380-minute peak came on December 1, not even during Christmas week. Its worst day wasn’t a holiday. It was a Monday.
But doesn’t a peak wait just mean one bad moment? Look at which rides appear on both charts. Hagrid’s, Battle at the Ministry, Mine-Cart Madness, Mario Kart: they’re not spiking to 300+ on freak days. They’re grinding at 100+ every day and occasionally tipping over. The peak is a symptom. The average is the disease.
The Fourteen-Seat Ceiling
Every wait time has a cause, and this one has a number. Fourteen seats per vehicle, no chaining, no trains. That caps theoretical throughput (the number of riders the system can move per hour) at roughly 1,000–1,200. In practice, the number is often lower.
But doesn’t Hagrid’s have a similar problem? It does, and Hagrid’s is #3 on the national list at 103.9 minutes. The difference is that Hagrid’s has had over six years to optimize. Battle at the Ministry had seven months.
The shakedown was rough. During team member previews in early May, the ride couldn’t sustain more than 3–4 vehicles simultaneously. On opening day, the app posted a 300-minute wait before a single guest had boarded (reported by WDWNT and AllEars). That number wasn’t a measurement. It was a prediction. The ride hadn’t actually opened yet.
Universal’s response was a series of escalating concessions. First, a virtual queue during previews (abandoned by opening day). Then Express Pass eligibility at $190–$340 per day (per BlogMickey), a reversal from the original standby-only plan. By January 2026, Universal began closing the queue entirely during peak periods (per Inside the Magic). The industry term is “at capacity protocol.” The practical term is: you can’t get in line.
The Shakedown (and the Recovery)
In 2025, Battle at the Ministry experienced downtime (periods when the ride stopped operating due to mechanical issues) on 155 of 223 operating days. That’s 69.5%: seven out of every ten days, something went wrong. Queue availability, the percentage of park operating hours during which the ride had an active posted wait and was accepting new guests, averaged 28.9% for the year. Less than a third of the time. If the Matterhorn had this record, Disney would declare a state of emergency.
Then something changed.
Queue availability in March 2026 hit 90.1%. That’s not incremental improvement. That’s a tripling. The lift system that couldn’t sustain more than a few vehicles in May 2025 is now keeping the ride open nine out of every ten hours.
But the monthly chart compresses a story that the weekly data tells much more clearly. Zoom in on Q1 2026 and watch the color shift from coral to teal:
In the first week of January, Battle at the Ministry posted a 166-minute weekly average. By the last full week of March: 66 minutes. A 60% drop in thirteen weeks, during spring break, not a lull. The one anomaly, March 16–22, spiked to 11.9 hours of weekly downtime but posted only a 108-minute average. That’s the more encouraging pattern: the team kept the queue open through the breakdowns instead of shutting guests out. More people rode.
Every complex ride system in history (Forbidden Journey, Flight of Passage, Rise of the Resistance) had a rough first year. Steady-state reliability typically takes 18–24 months. Battle at the Ministry is ten months in and already approaching that threshold. The waits are still long. They may always be long; fourteen seats is fourteen seats. But the days of 69.5% downtime rates and opening-day meltdowns are receding. The machine is learning.
The Tuesday Paradox
Here is the single most useful piece of information in this report, and it contradicts everything you’d assume:
Weekdays are 36 minutes longer than weekends. Tuesday through Thursday averaged 130 minutes. Saturday and Sunday averaged 94. That gap held steady across every month in the dataset. It is not noise.
We’re calling this The Tuesday Paradox: the intuition that weekdays are slower at theme parks is wrong at Epic Universe. Families on week-long trips plan a dedicated “Epic day” and overwhelmingly schedule it for a weekday, saving weekends for Disney, SeaWorld, or rest days. Tuesday through Thursday absorb the full concentrated demand of every multi-day ticket holder in the resort. Weekends spread that demand across the entire Orlando ecosystem.
This pattern is holding in 2026: Tuesday through Thursday still averages 135.8 minutes versus Sunday’s 107.7. The 28-minute weekday penalty is structural, not seasonal. If you’re planning a trip: go on Sunday. For a day-by-day crowd forecast, see our Easter 2026 Crowd Forecast.
The 3 PM Wall
By 10 AM the ride hits 152.4 minutes average and stays above 125 through 5 PM. We’re calling this The Wall: a seven-hour block where the average wait never drops below two hours. Rope drop doesn’t help. At 8 AM, with the shortest possible queue, the ride still averaged 109 minutes. You’ll arrive at 8 and board at 10.
The escape hatch: the last two hours. By 8 PM the average drops to 65 minutes. By 9 PM, 41. If you can stay late, the ride that consumed other people’s entire afternoons becomes a manageable wait.
There’s a second reason to wait. The ride is most likely to break down between 10 AM and 1 PM, when the mechanical stress of a full queue hits hardest. In Q1 2026, the 11 AM hour saw downtime on 28% of operating days, with uptime running at 88%. By 7 PM, uptime hit 97%. The evening isn’t just shorter waits. It’s a ride that’s more likely to be running when you reach the front.
Sixteen Days Apart
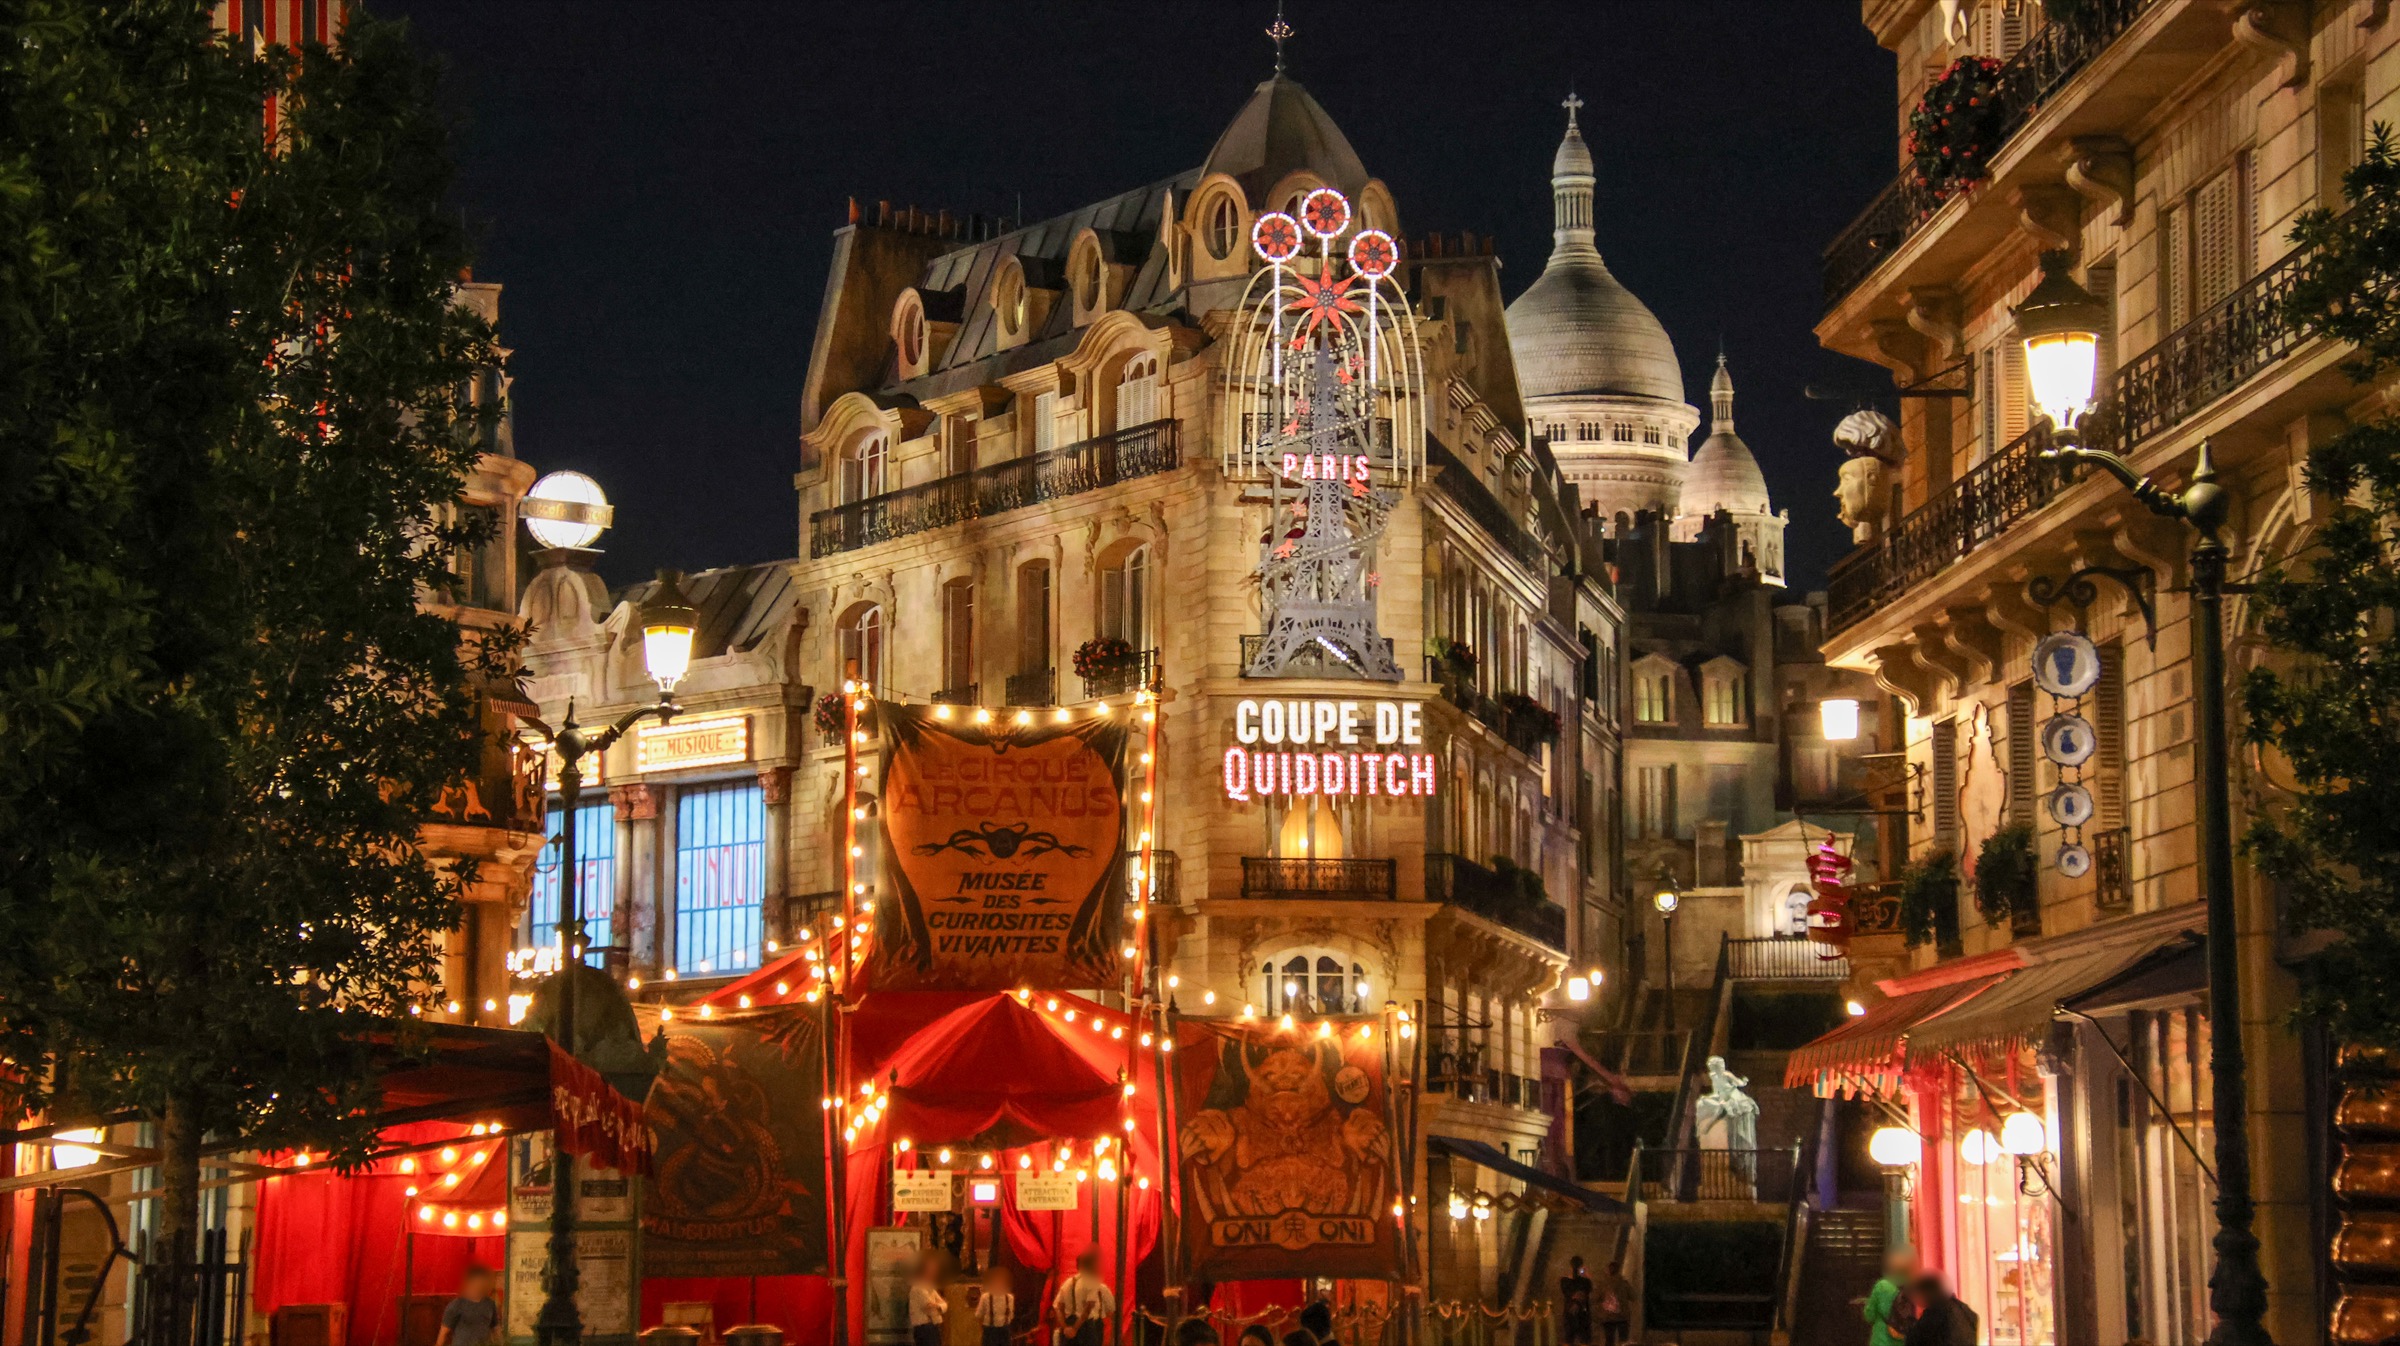
The Ministry of Magic land at night. Parisian rooftops, Quidditch banners, Sacré-Cœur in the distance.
The worst day in 2025 (December 23, a Tuesday in Christmas week) averaged 225.5 minutes. The best day (December 7, a Sunday) averaged 29.3. Sixteen days apart. Same building. Same fourteen seats.
You are not going to beat this line. You are going to choose when to stand in it. The capacity constraint is permanent because the rooms that make the ride extraordinary are the same rooms that make high throughput impossible. Nobody is flying across the country for a ride with more seats and smaller sets. Universal knew that. The data says they were right. Go on a Sunday. Go late. The queue itself is half the experience.
The Cheat Sheet
How to Beat the Wait
Best day: Sunday (93 min avg vs. 130 on Tuesday–Thursday).
Best time: Last two hours of the day. 9 PM averages 41 minutes.
Worst day: Tuesday–Thursday, any month.
Worst time: 10 AM–5 PM. Expect 130+ minutes.
Worst month: October (HHN spillover) and Christmas week (everything).
Rope drop? Works 88% of the time. Budget 30 min for the other 12%.
The queue and the land: Take it slow. The streets, the shops, the queue itself – they’re half the experience.
Sources
Universal Orlando · Tommy Themed · WDWNT · AllEars.Net · BlogMickey · Inside the Magic · Theme Park Tribune · Back to the Movies · Coaster101
Photo Credits
- Ministry facade – Michael Czeiszperger
- Ministry atrium queue – Michael Czeiszperger
- Ministry skyline at night – Gfgbeach, released under CC0 1.0 (public domain)