US Theme Park Easter Vacation 2026: Crowd & Downtime Forecast
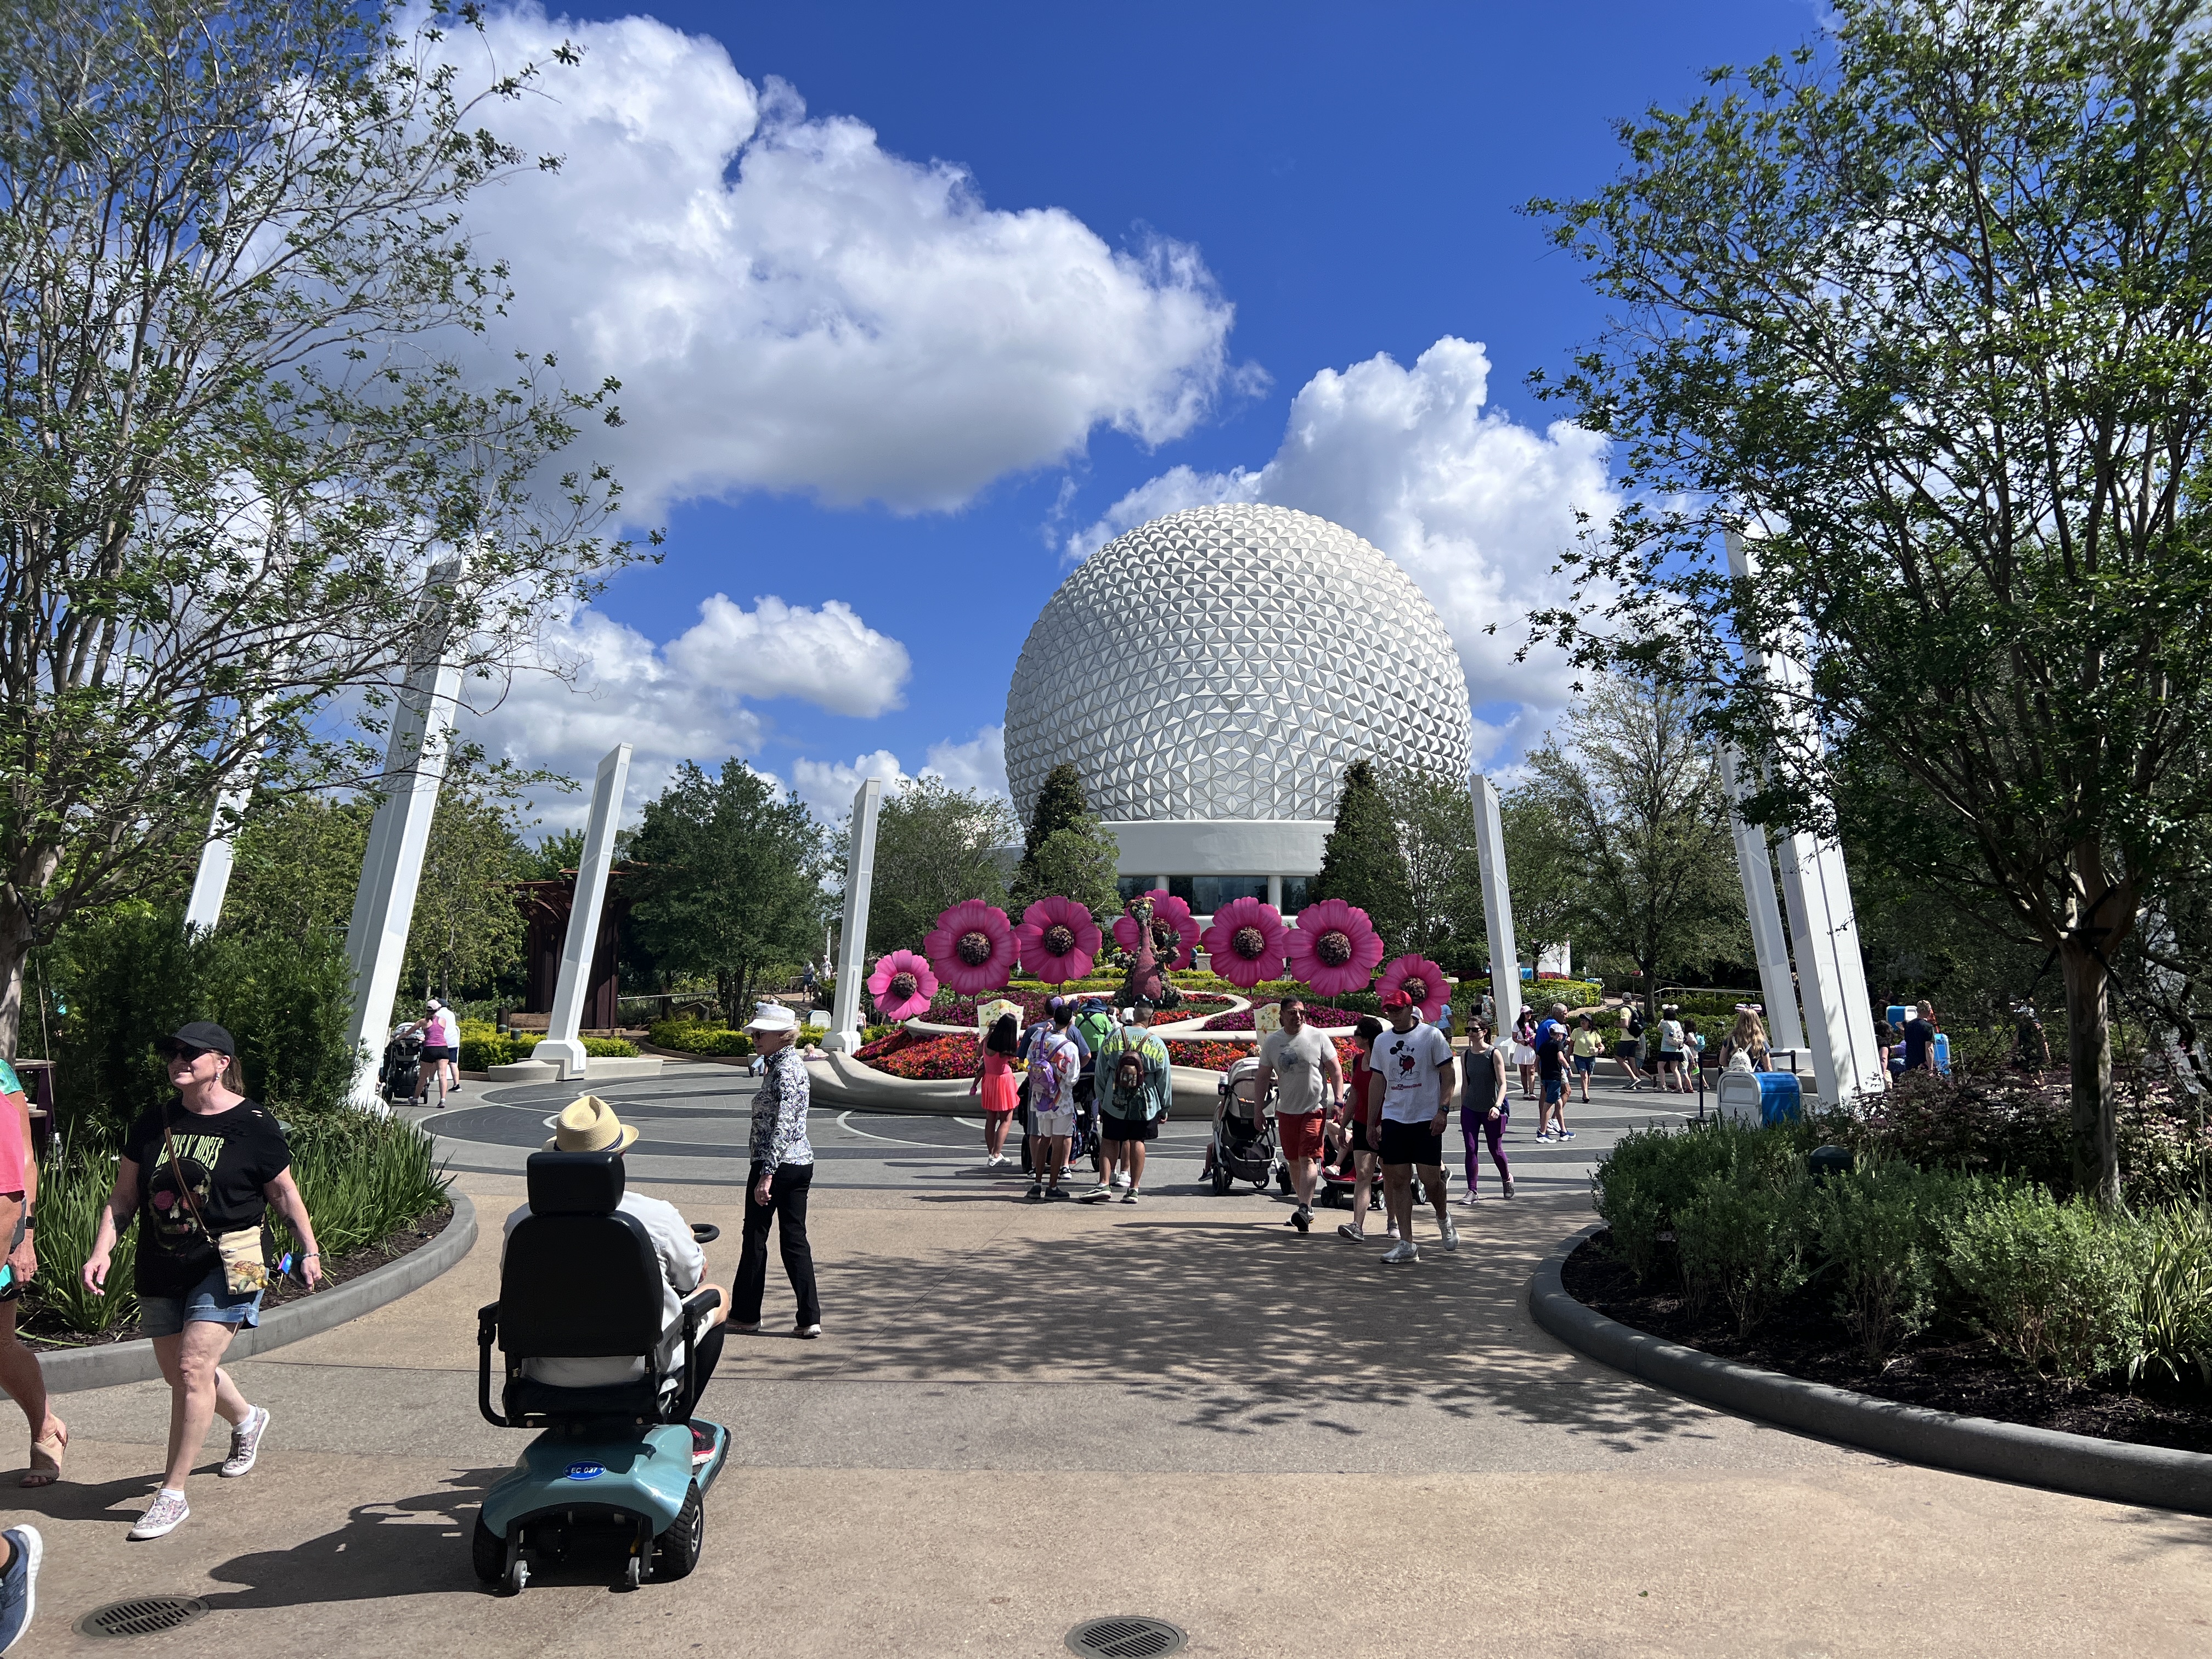
EPCOT’s Flower & Garden Festival, spring 2025. Photo: Michael Czeiszperger
Easter Week 2026: The Best Day Is the One Nobody Picks
The best day to visit a theme park during Easter vacation is Easter Sunday. Not the quietest day in the window (that’s March 25). But the most surprising. Tier 1 headliner waits (the flagship rides people actually queue for: Space Mountain, Hagrid’s, Velocicoaster) on Easter Sunday average 32.7 minutes across four years of Orlando data. That’s essentially identical to the best days in the early window. A perfectly average day hiding inside the busiest week of the year, because a sufficient number of families chose church and brunch over Space Mountain.
This report covers 14 parks across March 24 through April 9, 2026, built on 4 years of production data aligned to Easter. One warning before you read the charts: our raw predictions for the early window (March 24 through 27) are approximately 12% too optimistic. Two of the largest feeder districts, Miami-Dade and Chicago (roughly 680,000 students combined), set their spring breaks by the calendar, not by Easter. In past late-Easter years their breaks fell outside our analysis window. This year they land squarely in it. We call this The Miami-Chicago Correction, and we applied it.
Best Two Days: Wednesday Mar 25 and Friday Mar 27
Across all Orlando parks, Tier 1 headliner waits are lowest on these two days. After adjusting +12% for a spring break scheduling bias (Miami-Dade and Chicago overlap not present at these Easter offsets in past years), adjusted estimates are ~43 min and ~46 min, still 20% lower than the Easter week peak (Apr 2). March 27 also has the fewest ride breakdowns of the entire window. Both downtime and spring break analyses confirm the recommendation, though the margin is thinner than raw data suggests.
Worst Day: Thursday Apr 2 (The Breakdown Multiplier in Action)
Peak crowds converge with peak breakdowns. T1 waits hit 55.3 min (3-park avg), with 22 breakdown events across Orlando. Avoid March 30 through April 3 if possible.
The Easter Sunday Paradox: It’s Not Church
Here is what the rest of the internet says about Easter Sunday at a theme park:
Our data says they’re wrong. Not about Easter week (that really is peak). But about Easter Sunday. Tier 1 headliner waits on Easter Sunday average 38.8 minutes across four years. The surrounding days average 51 to 53. That’s a 25% drop on the day every crowd calendar tells you to avoid.
The obvious explanation is that families attend Easter services in the morning, then hit the parks in the afternoon. If that were true, you’d see the gap shrink after noon as the churchgoers arrive. It doesn’t. It widens.
At 8 AM, Easter Sunday and Saturday are nearly identical: 33 vs. 35 minutes. By 1 PM the gap is 13 minutes. By 5 PM it’s 14. The afternoon churchgoers never showed up. Islands of Adventure shows the most dramatic version of this: 40 minutes on Easter Sunday vs. 63 on Saturday at 5 PM.
The more likely explanation: Easter Sunday is a travel turnover day. Families who planned their park days for the surrounding week are checking out of their hotels. The next wave of arrivals hasn’t checked in yet. Add the families who chose a slower Easter morning (church, brunch, the hotel pool) and never made it to the parks at all, and you get a day where fewer people are in the parks from open to close. Not a morning dip. An all-day one.
The Tier 1 Trap: Why Park Averages Lie
We call this The Tier 1 Trap. Parks like Magic Kingdom have many low-tier rides (Barnstormer, Tomorrowland Speedway) whose 5 to 10 minute waits drag the park average down, making the park look less crowded than it feels on the rides that matter. The rides people plan their days around are the ones that matter for crowd strategy. Filtering to Tier 1 headliners only reveals the true competitive experience, and the gap is striking.
Walt Disney World: Four Parks, Four Personalities
All four Walt Disney World parks compared head-to-head across the Easter window. This chart uses all-tier average wait times (not filtered to headliners) to give the broadest picture of each park's crowd levels. The dashed lines show the spring-break-adjusted prediction for Mar 24-27.
Hollywood Studios is the most crowded park in the window, peaking at nearly 65 minutes on Mar 30. It has the fewest rides, the most headliner-heavy lineup, and no good place to hide when the lines get long. Animal Kingdom shows the sharpest peak-to-trough swings; its Apr 3 spike likely reflects Flight of Passage surge pricing days. Epcot is the calm one. Even during Easter week, it’s the least crowded of the four, and during this window it’s peak Flower & Garden Festival season: 70+ topiaries, outdoor kitchens, and the kind of slow-paced wandering that crowds can’t ruin. If you insist on Hollywood Studios during peak week, bring a book.
All 14 Parks, Side by Side
Tier 1 headliner wait times across all 14 parks. Use the tabs to switch between them. Aquatica and Legoland have no Tier 1 rides, so their Tier 1+2 data is shown instead.
The Breakdown Multiplier: When Crowds Break the Rides
Higher crowds do not just mean longer waits. They also stress rides. We analyzed historical Tier 1 breakdown counts (number of DOWN events per day) and downtime hours across all Orlando parks, building on data from our 2025 Annual Ride Reliability Report. The pattern is clear: peak crowd days have ~80% more breakdowns than low-crowd days. So on the worst days you wait longer and have fewer rides to wait for. The system punishes you twice.
The Breakdown Multiplier Confirms It: March 27 Is the Day
March 27 (Fri) has the fewest T1 breakdowns in the entire window: 18.3 events vs. 33.3 on the worst day (Apr 3). Choosing the right day means shorter waits and more rides actually running.
Most Breakdown-Prone Headliners During Easter
| Ride | Park | 4-Year Easter Breakdowns | Avg Duration |
|---|---|---|---|
| Hollywood Rip Ride Rockit | Universal Studios FL | 117 | 74 min |
| Hagrid's / Forbidden Journey | Islands of Adventure | 65 | 90 min |
| Pirates of the Caribbean | Magic Kingdom | 60 | 92 min |
| Jurassic Park River Adventure | Islands of Adventure | 59 | 141 min |
| Spaceship Earth | Epcot | 57 | 114 min |
| Mickey & Minnie's Runaway Railway | Hollywood Studios | 57 | 40 min |
| Seven Dwarfs Mine Train | Magic Kingdom | 55 | 70 min |
| Space Mountain | Magic Kingdom | 54 | 71 min |
| Test Track | Epcot | 49 | 119 min |
| Skull Island: Reign of Kong | Islands of Adventure | 47 | 170 min |
The Spring Break Adjustment
One caveat on the early window. Our model averages historical data aligned to Easter, but not all school districts set spring break by Easter. We researched 7 major Orlando feeder districts across all 4 years and found that Miami-Dade and Chicago (roughly 680,000 students combined) use fixed late-March schedules. In late-Easter years, their breaks fell outside our analysis window, so our raw averages for March 24 through 27 are about 12% too optimistic. The dashed lines on the charts above show the adjusted predictions. March 25 and 27 are still the best days. The margin is just thinner than the raw data suggests.
What This Data Actually Tells You
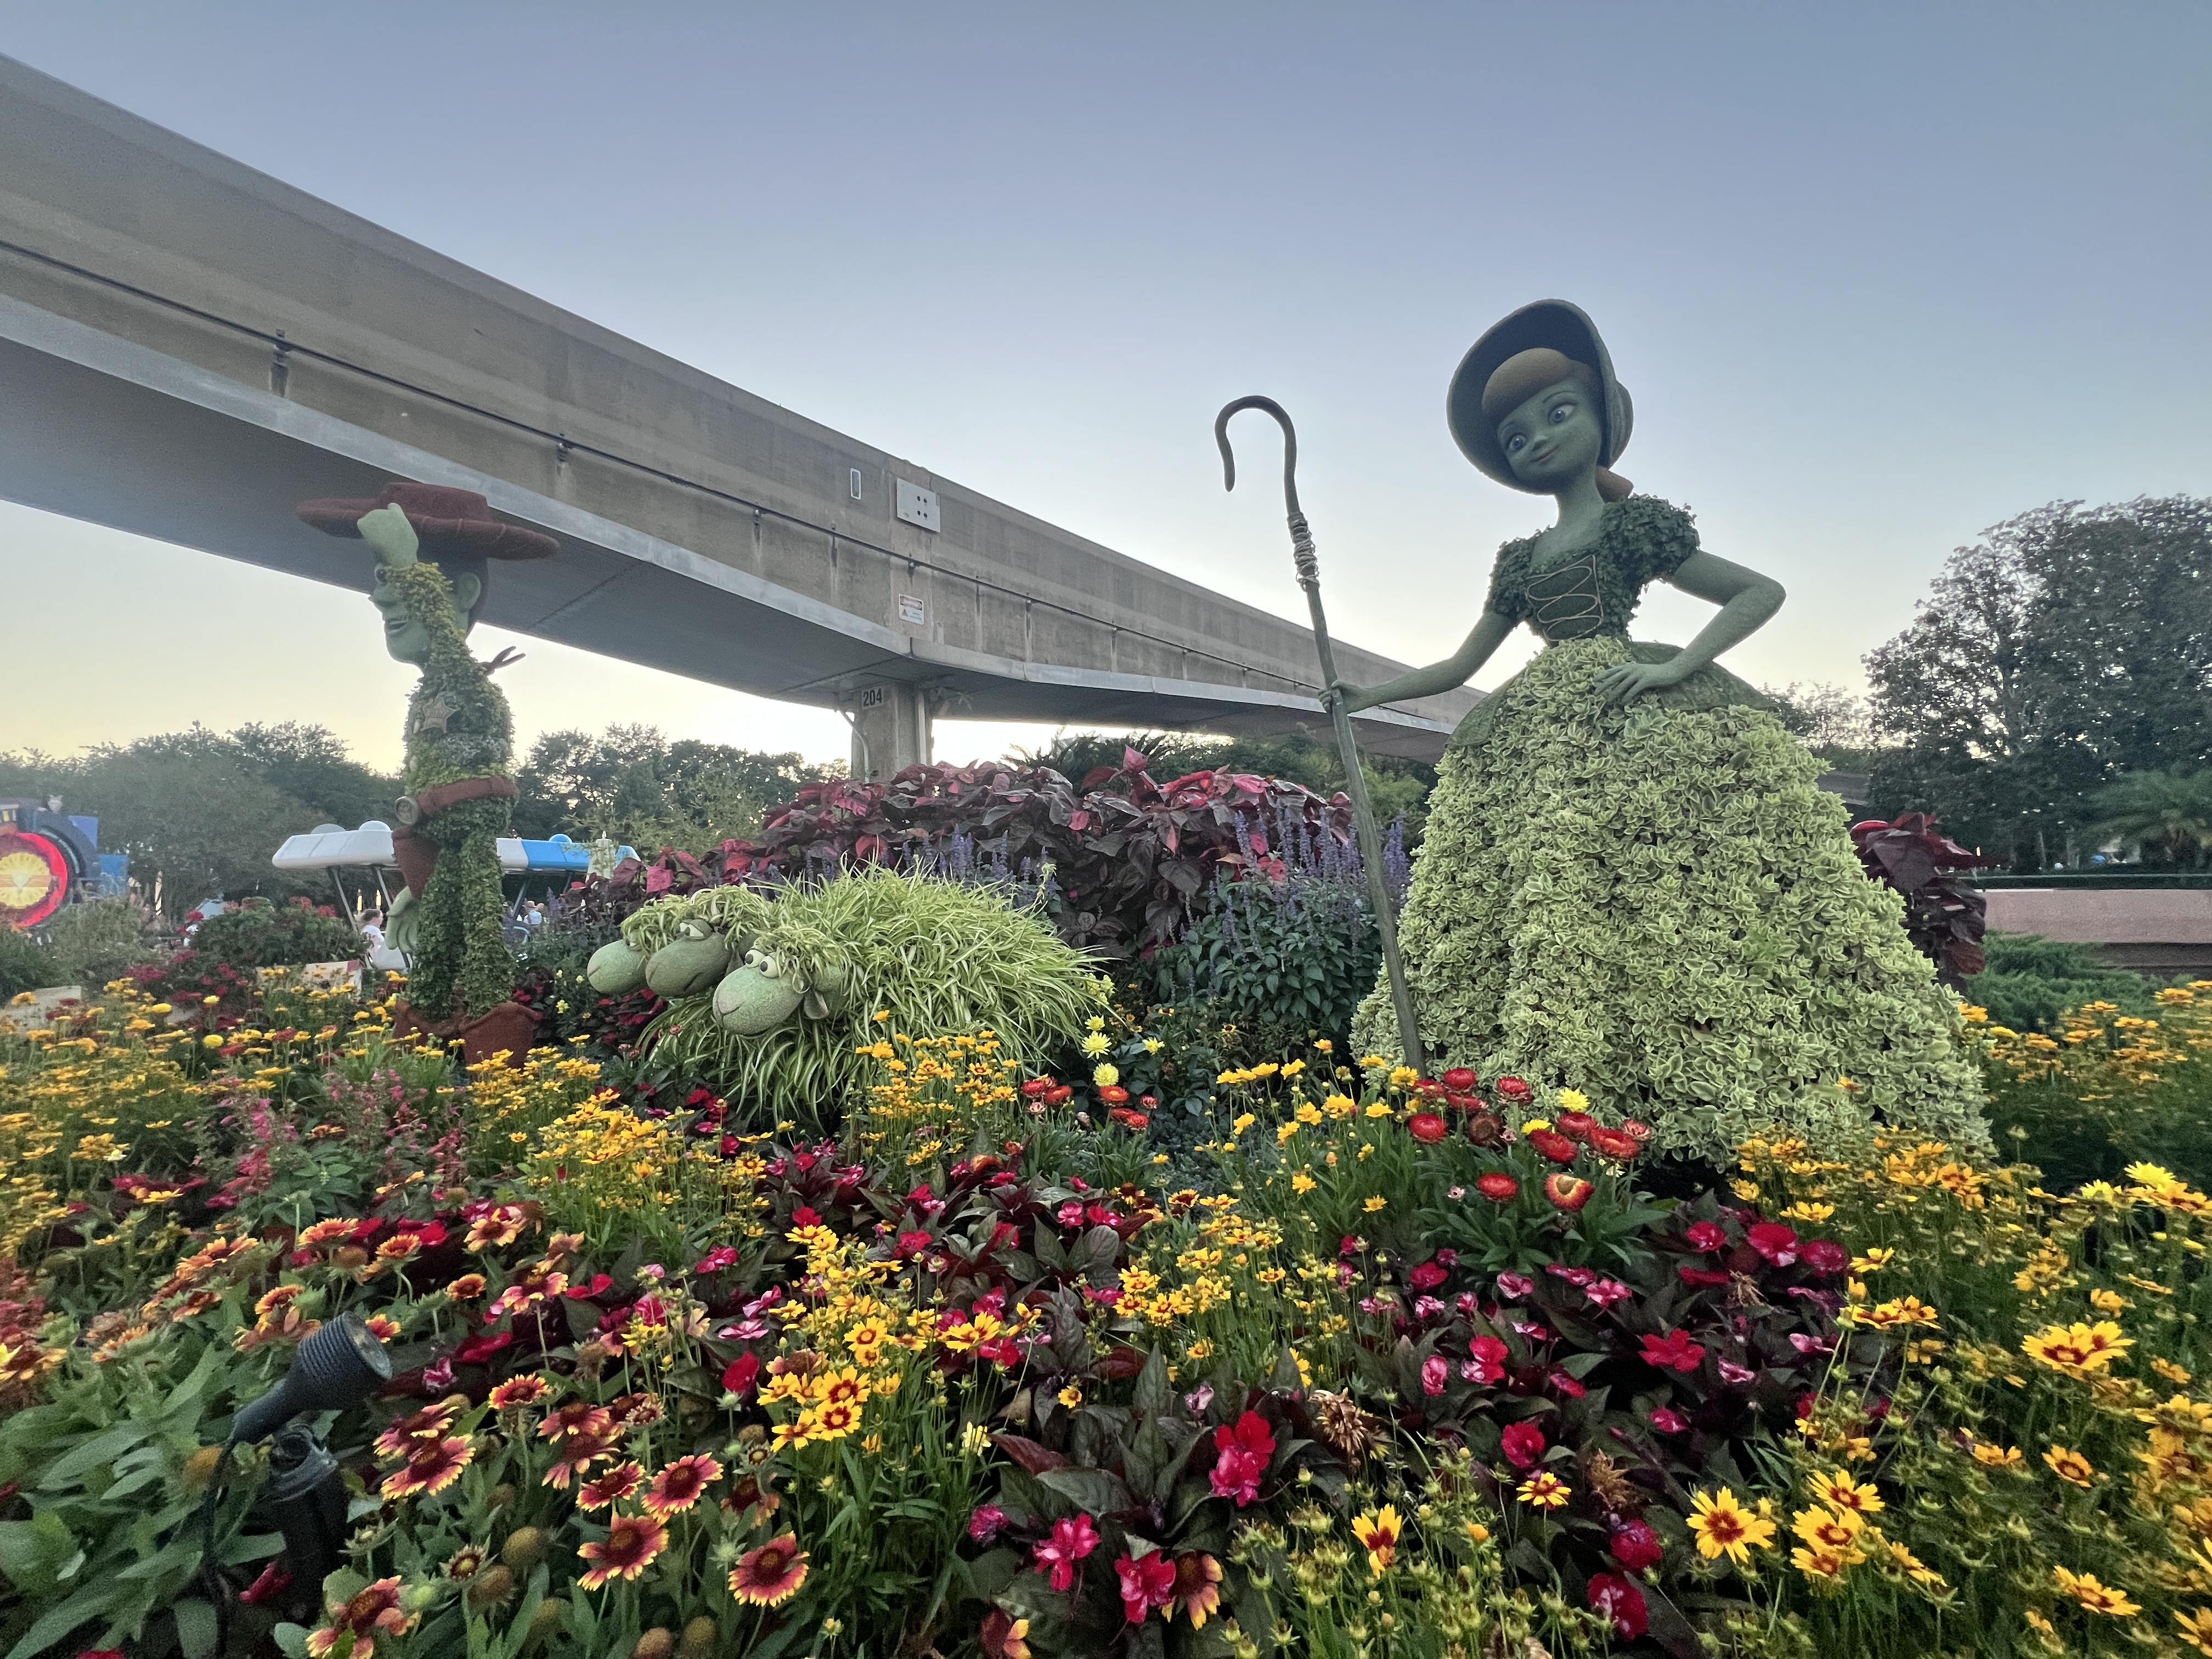
EPCOT Flower & Garden Festival. Photo: Michael Czeiszperger
Author’s note: We believe in these numbers enough that we’re going to Orlando on Easter Sunday to test them ourselves. We’ll publish a follow-up with actual wait times, ride counts, and whether the paradox held. If the data was wrong, you’ll be the first to know.
The parks know when you are coming. They have the same school calendars we researched. They have better attendance models than ours. The staffing, the ride capacity, the Lightning Lane pricing that shifts by the hour: none of it is accidental. When you visit during the peak window and wait 55 minutes for a headliner that breaks down twice that day, you are not encountering bad luck. You are encountering a system. But these parks are also genuine works of art, and Easter week in Orlando is still something your family will carry for years. Both truths hold. Go early in the window. Go on a Sunday. Spend the crowded afternoons in the parts of the park that don’t have a queue. And if you can only go during peak week, go knowing what the numbers say, not what the brochure promises.
Appendix: How We Built This Forecast
Data Source
All wait-time and downtime data comes from our production database. We collect ride status snapshots every 5 minutes via the ThemeParks.wiki API, including posted wait times for every operating ride. We filtered to park_appears_open = 1 and wait_time > 0, with UTC timestamps converted to Eastern Time for day boundaries.
Easter-Relative Alignment
Spring break crowds follow Easter, not the calendar. Since Easter moves by up to 4 weeks year-to-year, comparing fixed calendar dates across years is meaningless. Instead, we align each year’s data by days relative to Easter (E-12 through E+4), then average.
| Year | Easter | E-12 (Mar 24) | E+4 (Apr 9) |
|---|---|---|---|
| 2022 | Apr 17 | Apr 5 | Apr 21 |
| 2023 | Apr 9 | Mar 28 | Apr 13 |
| 2024 | Mar 31 | Mar 19 | Apr 4 |
| 2025 | Apr 20 | Apr 8 | Apr 24 |
| 2026 | Apr 5 | Mar 24 | Apr 9 |
Tier Filtering
Each ride has a tier classification (1=flagship/headliner, 2=standard, 3=filler) from our AI-assisted classification pipeline with manual overrides. This report primarily uses Tier 1 only data, since those are the rides guests plan their days around.
Downtime Analysis
We counted distinct DOWN status events (not individual 5-minute snapshots) for Tier 1 rides during each day of the Easter-relative window. This captures actual breakdowns rather than a single sustained outage inflating the count.
Spring Break Correction
We researched actual spring break dates for 7 major Orlando feeder school districts across all 4 historical years. Miami-Dade and Chicago have fixed late-March schedules that do not track Easter. In late-Easter years (2022, 2025), their breaks fell well outside our analysis window, so our Easter-relative averages for E-12 to E-9 systematically understate crowds. We applied a +12% adjustment to Mar 24-27 based on the estimated attendance impact of two ~350K-student districts being on break.
Limitations
- Epic Universe has only 1 year of data (opened March 2025); see our Battle at the Ministry deep dive for detailed wait patterns
- New rides/closures in 2026 (e.g., Buzz Lightyear reopening Apr 8) are not reflected in historical data
- The +12% spring break adjustment is an estimate; the actual impact depends on what fraction of families travel to Orlando vs. other destinations
- We tracked 7 major feeder districts, but hundreds of smaller districts also contribute
- Busch Gardens downtime hours are inflated by CLOSED-as-downtime for non-Disney/Universal parks; breakdown counts are more reliable